Device list
The device list is a list of all devices connected to your account. The device list is a great way to get an overview of all your devices and their status.
Device status
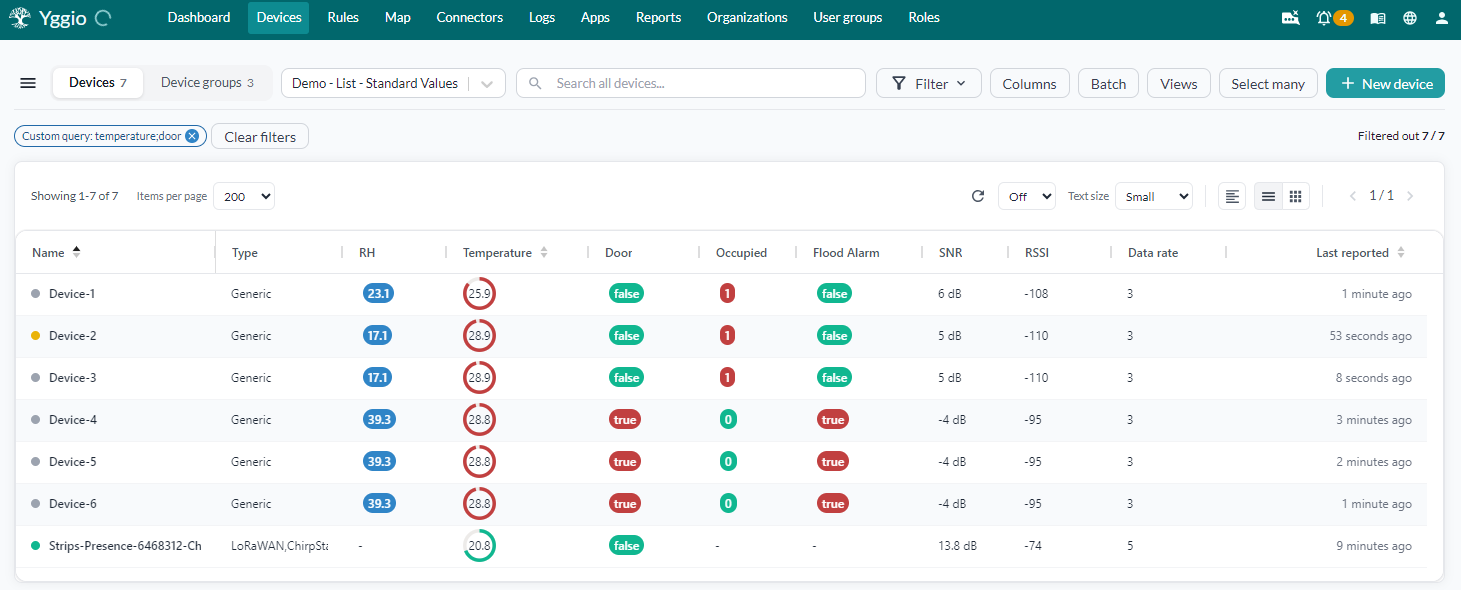
Every device shows a coloured dot next to its name, and a status pill in the Status column counting the checks behind it. Click either to see the individual findings. The dot takes the colour of the most serious one: green for OK, yellow for a warning, red for an error.
For LoRaWAN devices, two of those findings describe the radio link. They are reported separately because they measure different things and have different remedies. A device can be heard perfectly and still be expensive to run, and the other way round.
Signal strength
How well the receiving gateway hears the device, in dBm, taken from the strongest gateway that received the last uplink.
SNR is added to RSSI when SNR is negative, because a transmission below the noise floor genuinely weakens the link. A positive SNR is headroom, not extra reach, so it does not improve the rating.
| Signal strength | Rating | Colour |
|---|---|---|
| Above -110 dBm | Excellent | Green |
| -110 dBm down to above -115 dBm | Good | Green |
| -115 dBm down to above -120 dBm | Fair | Green |
| -120 dBm down to above -124 dBm | Poor | Yellow |
| -124 dBm or below | Bad | Red |
| Overdue on its expected report interval | Offline | Red, struck-through icon |
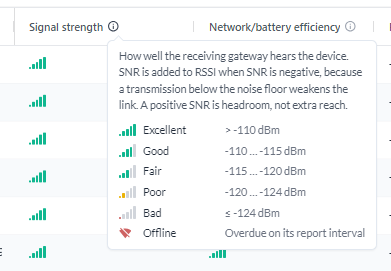
A LoRaWAN device that has not reported within its expected report interval shows Offline instead of a rating. The last reading it sent no longer describes a link that is carrying anything. A device that declares no expected report interval is never called offline, because there is nothing for it to be late against.
Three of the five steps are green: a link at -118 dBm still delivers its messages reliably. Only below -124 dBm is the link genuinely at risk.
Signal strength does not depend on the spreading factor. A device a few metres from its gateway has an excellent signal even while it is still transmitting at SF12.
Network/battery efficiency
What the link costs. A high spreading factor keeps the radio transmitting far longer per message, which drains the battery faster and consumes more of the shared duty cycle.
| Spreading factor | Data rate (EU868) | Rating | Colour |
|---|---|---|---|
| SF7 | DR5 | Excellent | Green |
| SF8 | DR4 | Good | Green |
| SF9 | DR3 | Good | Green |
| SF10 | DR2 | Fair | Green |
| SF11 | DR1 | Poor | Yellow |
| SF12 | DR0 | Bad | Red |
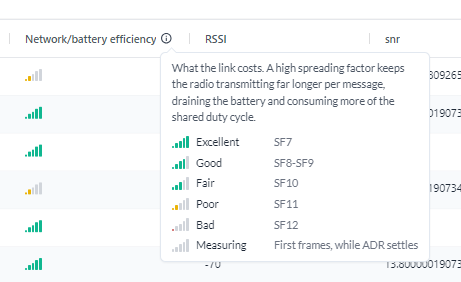
This is the column that separates a good link from a cheap one. A device at SF11 or SF12 can sit right next to its gateway with an excellent signal, and still spend far more energy per message than it needs to. The two columns disagree, and both are right.
The spreading factor is used when the device reports one. Otherwise the data rate is translated to a spreading factor using the EU868 mapping above. Other regions pair data rates with different spreading factors, so an efficiency rating derived from the data rate alone can be optimistic outside EU868.
Poor efficiency never turns the status dot red. Its contribution to the device status is capped at a warning, even for SF12. A device that drains its battery faster is worth acting on, but it is not an outage.
Devices join at SF11 or SF12 and work their way down as adaptive data rate settles, so the first few frames say nothing about how the link will perform. Until three frames have arrived, efficiency reads Measuring rather than a rating.
Showing them as columns
Both ratings are available as columns. Add them from Customize columns, or apply the Connectivity preset, which shows the two meters next to the raw RSSI, SNR and spreading factor values they are derived from.
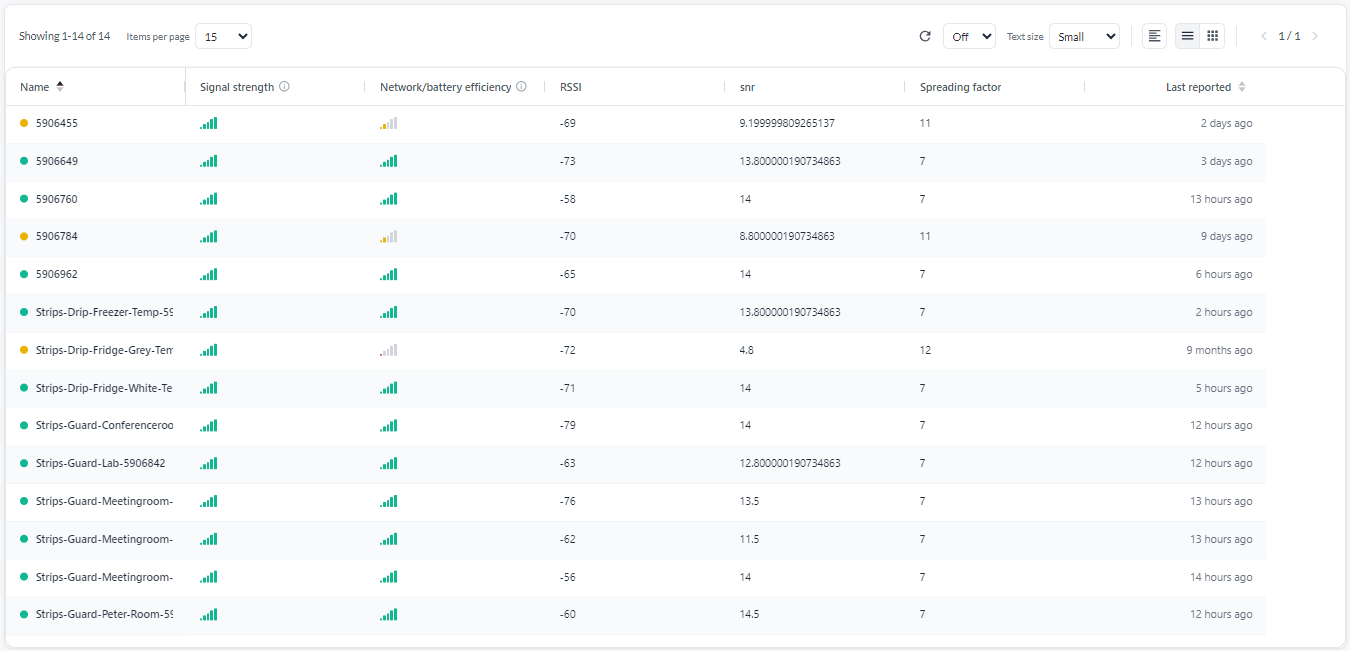
The columns show the meter alone. Hover over it to read the rating in words.
- More filled bars is better, in both columns. Five bars is Excellent, one is Bad.
- An unfilled meter means the reading is still being established.
- A struck-through wireless icon means the device is offline.
Above, the SF11 and SF12 devices carry a full green signal meter and a yellow efficiency meter. They are well within range of their gateway and still transmitting expensively.
Both ratings apply to LoRaWAN devices only. A device reached over MQTT or another integration has no LoRa signal, so both columns stay empty for it. Its silence is reported once instead, as Device did not report in time.
The info icon in each column header opens the full scale for that column, with the rule behind every step.
Options
The device list has a number of options that can be used to display, filter and sort the list of devices.

Narrowing the list
- Search: Search the list by device name. Type in the search box above the list and the list narrows as you type.
- Filter: Open the filter panel to narrow the list on more than the name. Filters combine, and the ones you have set are shown as tags above the list so you can see why the list is as short as it is. See Filters for what each one matches.
- Group by: Groups the list on the
orderfield.orderis free text you set per device: the list sorts alphabetically by it, and every device carrying the same text forms one group with its own heading and table. There is no list of groups to define - the groups are just the distinctordervalues across your devices. Setorderwith Select Many -> Edit -> Order, and see The Order field for how to name the values. Not to be confused with device groups, which are named sets you can select and act on.
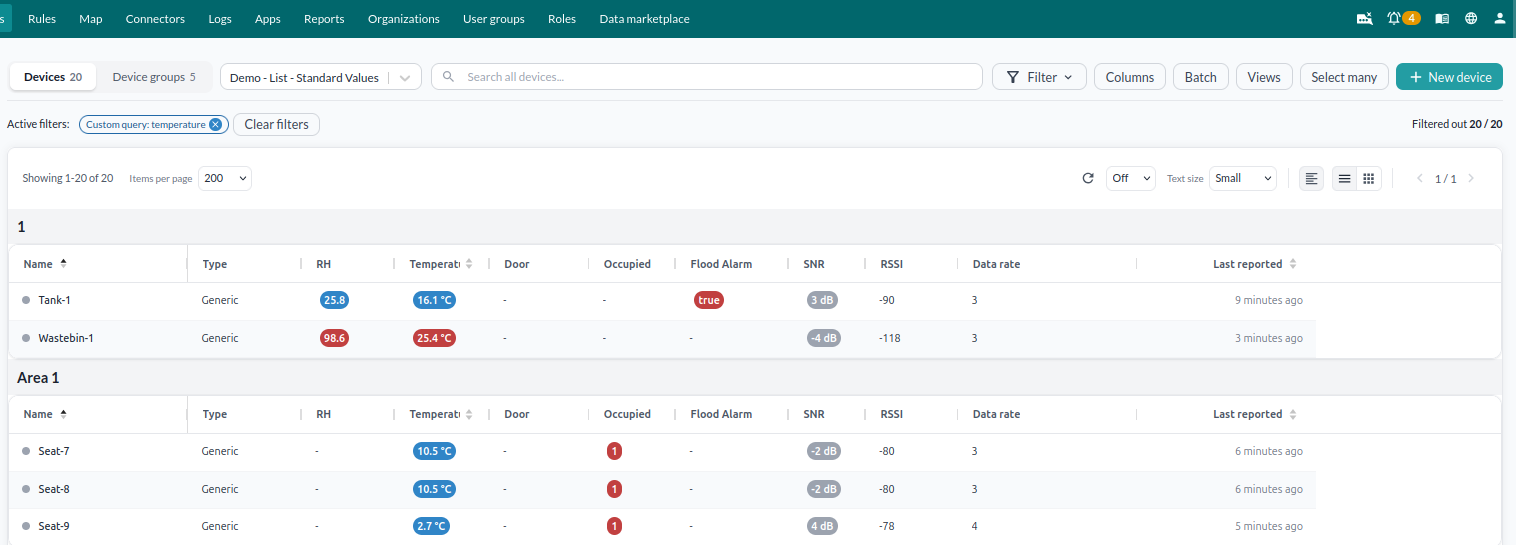
Choosing what is shown
- Columns: Apply a ready-made column preset, or build your own columns with names, colour coding and thresholds. Covered in Device views.
- Views: Switch between saved views with one click. A view stores the whole state of the list: filters, columns and their widths, colour coding, sorting, refresh rate, text size, layout, and whether the Views panel is open. Views can also be exported as JSON, or shared with an organisation. Covered in Device views.
- Table and grid view: Choose to display your device list in a table or grid view.
- Text size: Select text size for the device list.
How much loads, and how often
- Show number of devices: Shows the number of devices currently displayed in the list and the total number of devices connected to your account.
- Items per page: Select how many devices to display per page: 15, 25, 50, 100, 200, 500 or 1000. The default is 15. Larger pages take longer to load, so raise it when you are scanning and lower it when the list feels slow.
- Paging: Navigate through the device list using the paging buttons.
- Interval update: Refreshes the list when clicked, and lets you set an interval to do it repeatedly. Values themselves always update in real time, so this is not about seeing fresh numbers - what the refresh re-runs is the filters and the sorting. See What the refresh interval actually does.
Working on many devices
- Select many: Act on the devices you have selected. See Select many.
- Batch: Reach the bulk tools for the whole list rather than a selection. Use Batch install to add devices from a CSV file, and Batch update to change devices you have exported.
What the refresh interval actually does
Every device on the list updates its values in real time. A temperature that changes is already the new temperature on screen, with no refresh needed.
What the refresh interval re-runs is the filters and the sorting. A device joins or leaves a filtered list only when the filter is evaluated again. A list filtered on temperature above 25 holds the devices that were above 25 at the last filter run; one that has crossed 25 since appears at the next refresh, not the moment it crosses.
The sort order is re-applied at the same time. Filter on the condition you care about, sort by the value, and set an interval: devices that have deviated rise to the top of the list on their own. Saved as a view, that is a screen you can leave open and act on.
Filters
| Filter | Matches on |
|---|---|
| Name | The device name |
| Device model name | The deviceModelName, so a filter per hardware model |
| Type | The device type, for example LoRaWAN or Generic |
| DevEUI | A LoRaWAN device's DevEUI |
| Connector | The connector the device belongs to |
| Contextual parameter | A contextual parameter key and its value |
| Custom query | A FIWARE-style query, for anything the filters above do not cover. See Custom query |
| Reported within | Devices that have reported inside a time window you give |
Reported within takes an amount and a unit, so you enter the window you want rather than picking from a fixed list. The units are minutes, hours, days, weeks and months. "30 minutes" finds what is currently alive; "2 weeks" finds what has gone quiet.