Dashboards
With dashboards you can create a customized view that display data that you find important. This lets you find the information that you are intrested in quickly and easily.
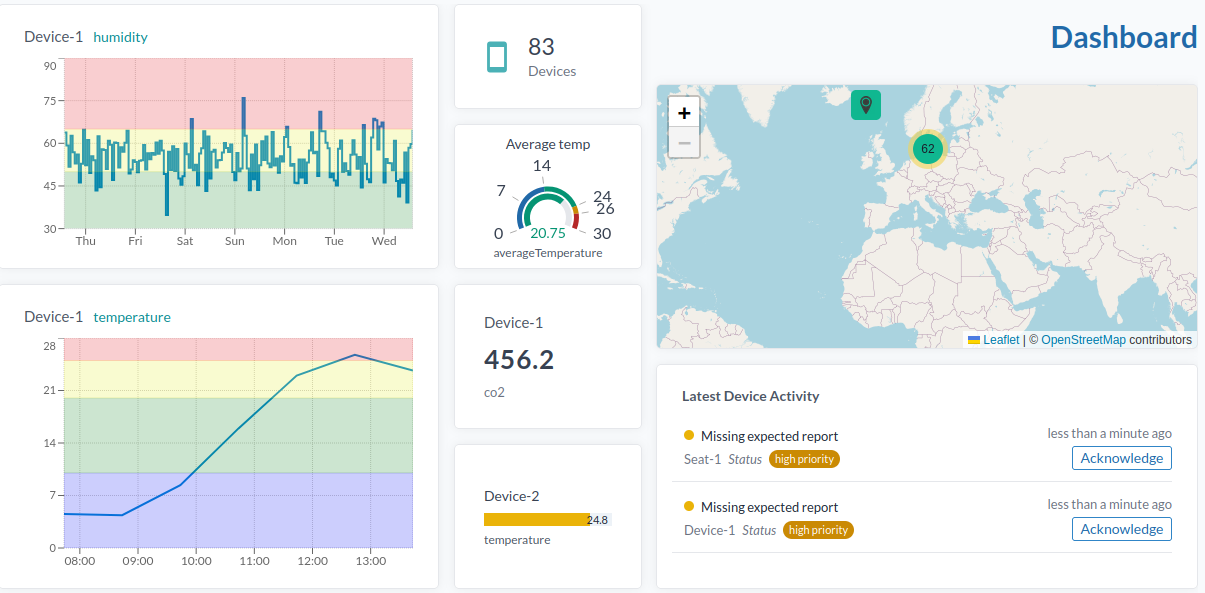
- A dashboard contains widgets which can be added, configured and placed as you like.
- You can choose from a variety of widgets such as graphs, maps, tables and more. More widgets will be added in the future.
- You can create multiple dashboards and switch between them.
- You can share a dashboard with other users.
- You can change the default dashboard by pressing Set as Default Dashboard. This will be the first dashboard you see when you log in.
Create a Dashboard
- 1.Press the cog wheel in the corner and select new dashboard.
- 2.Give it a suitable name.
- 3.Press "Create".
Add a Widget
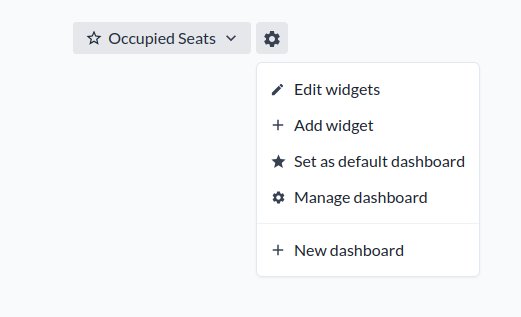
- 1.Press "Add widget".
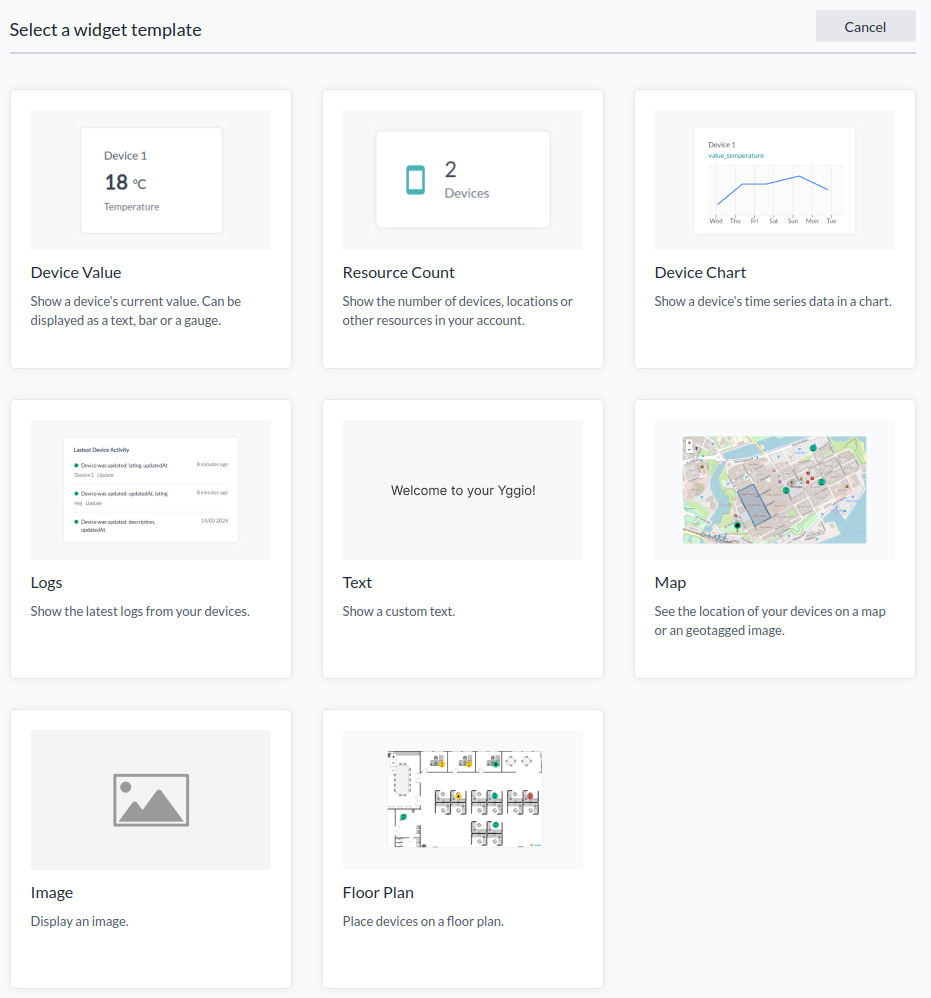
- 2.Choose the type of widget to add.
Device Value Widget
- The device value widgets display the value of a device either as a number, circle, bar or gauge.
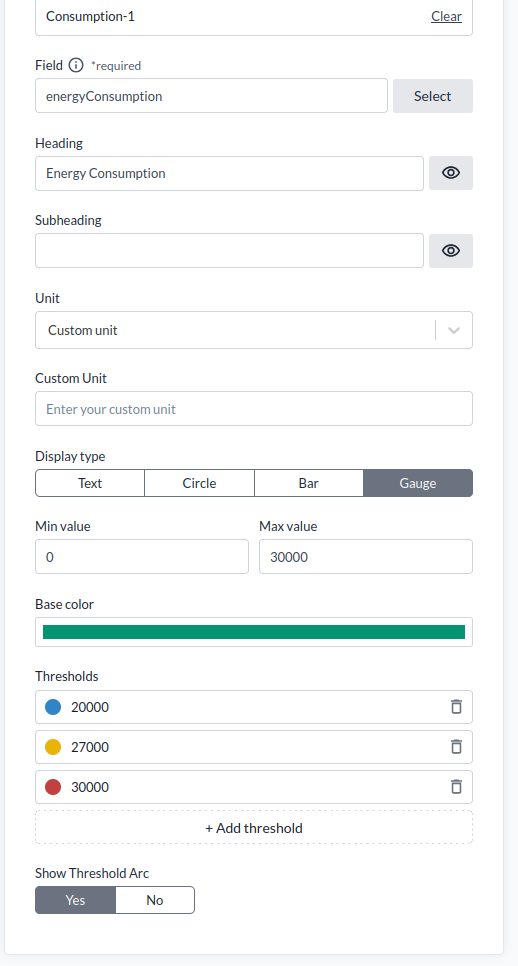
Set Up a Device Value Widget
- 1.Choose a configured device.
- 2.Select a value to display.
- 3.Choose a heading; otherwise, the device name will be shown.
- 4.Choose a subheading; otherwise, the displayed value will be shown.
- 5.Add a unit for the value.
- 6.Choose a display type.
- 7.Press "Create".
Display Types
- Text: Just text.
- Circle: Suitable for values that don’t exceed a certain limit. The minimum value is the smallest possible value, and the maximum value is the largest possible value.
- Bar: Similar to a circle but displayed as a straight line.
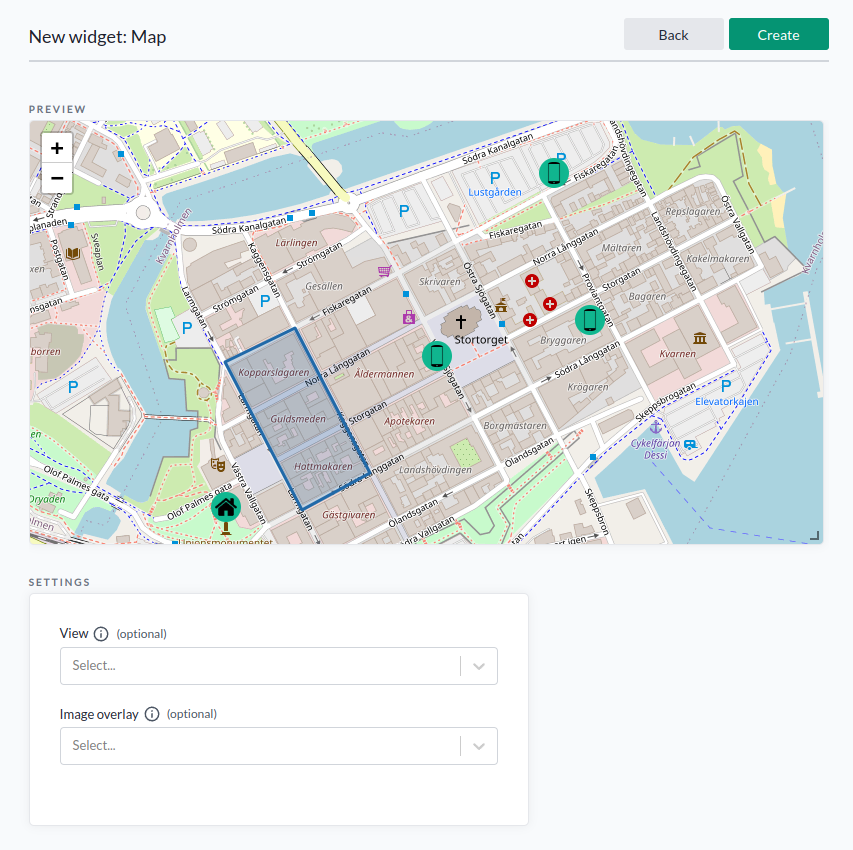
- Gauge: Similar to a straight line but bend and can have a Threshold Arc
Thresholds

- Thresholds change the color of a value. In the example, when the temperature is less than 15°C, the number will be the base color. If the temperature is between 15°C and 24°C, the color will be green. Between 25°C and 29°C, it will be yellow. If it exceeds 30°C, the color will be red.
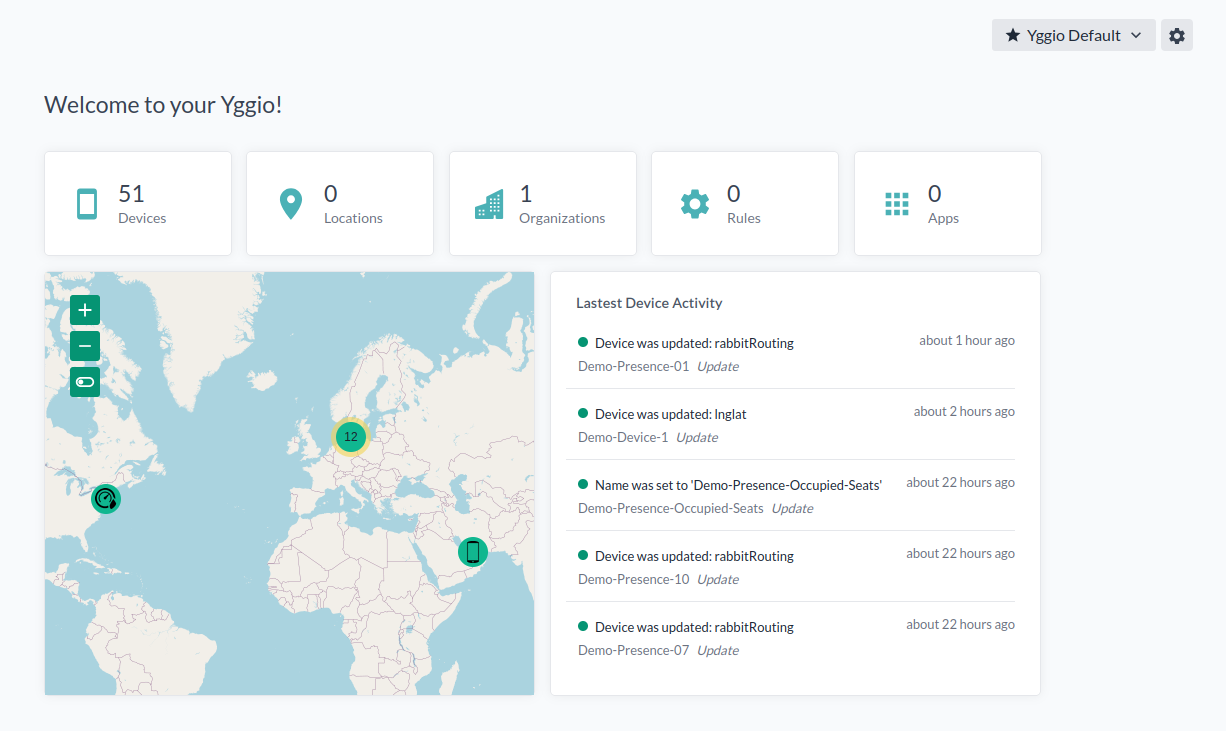
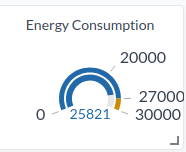
Resource Count
- The resource counter shows the number of devices, locations, organizations, apps, or rules.
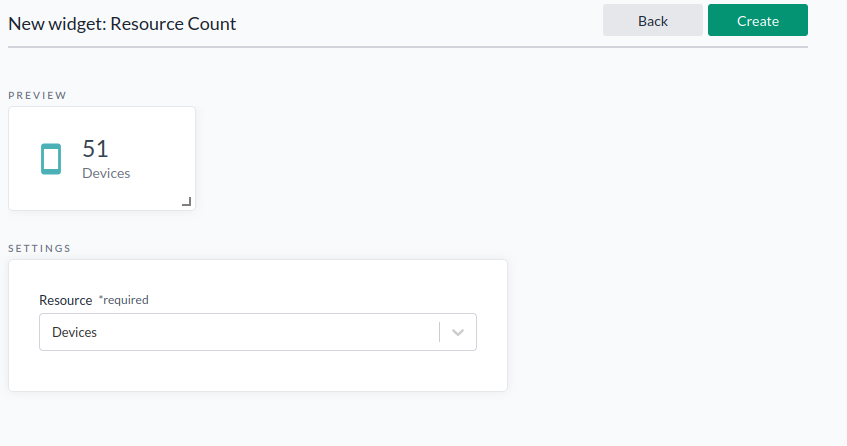
Map
-
Display a map (outdoor or indoor) with your devices.
-
You can choose to show one of your saved map views. See Map Views for more details.
-
You can upload and display an overlay image on top of the map.
- This is required if you want to use a floor plan with IoT nodes placed at their accurate WGS84 longitude and latitude position.
- An overlay image requires specifying the top-right and bottom-left corners in WGS84 coordinates.
- The IoT platform currently supports only overlay images aligned with the north-south axis. If your floor plan is rotated, it must be adjusted accordingly.
- Most GIS tools can be used to rotate and identify floor plan corners. If no GIS tool is available, it is recommended to use Google Earth Pro (desktop application) to identify the corners and rotation. You can then use a drawing tool, such as GIMP, to rotate the image.
-
You can define geofences on the map or on top of an overlay image.
- To enable this, check the option
Show create Geofenceand use the...button. - Each geofence can be associated with an IoT node that receives an event when a device:
- Enters (
access: enter) - Updates position inside (
access: inside) - Leaves (
access: exit)
- Enters (
- Geofences can overlap. In that case, all nodes associated with the overlapping geofences will receive the corresponding events.
- The geofence feature requires the
geoQueryFlow to be assigned to IoT nodes that should be supervised for geofence entry/exit. - To handle geofence events, you can use the standard translator
general-geofence, or develop a customized translator if your use case requires special logic.
- To enable this, check the option
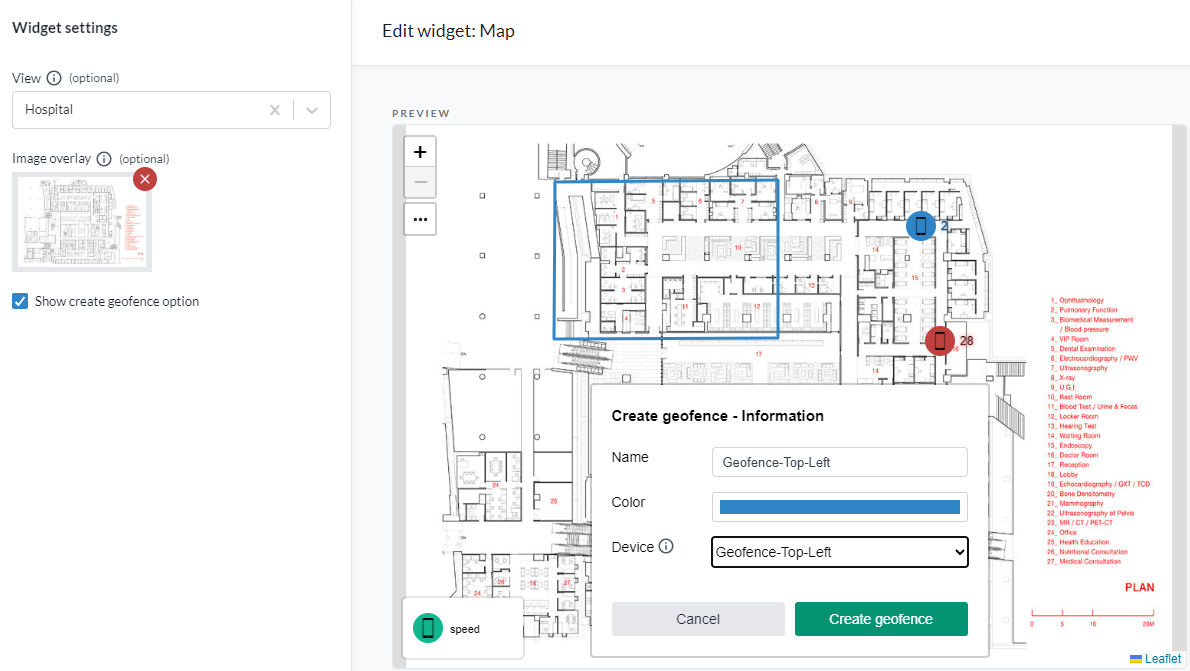 Draw Geofence in Map Overlay Image
Device Chart
- The device chart displays time series statistics of a value.
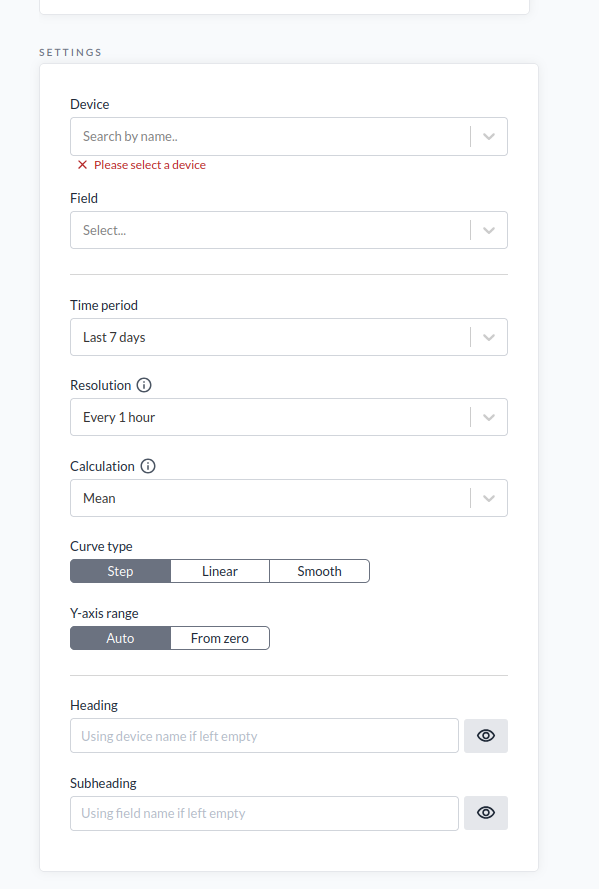
Setup
- 1.Choose a device.
- 2.Select the type of value you want to show.
- 3.Choose a resolution to display the data.
- 4.Select the way to calculate.
- 5.Choose the type of curve and x-axis range.
- 6.Choose a heading; otherwise, the device name will be used.
- 7.Choose a subheading; otherwise, the value type will be used.
- 8.Press "Create".
Device Logs
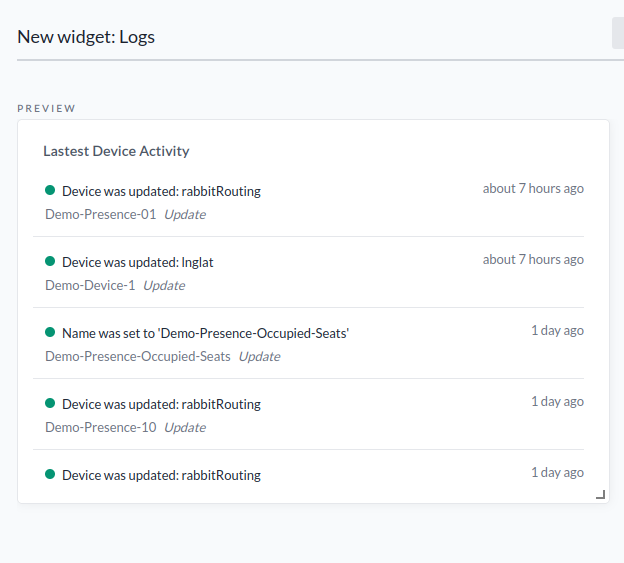
- Logs show the latest device activity. For more information, see logs.
Text
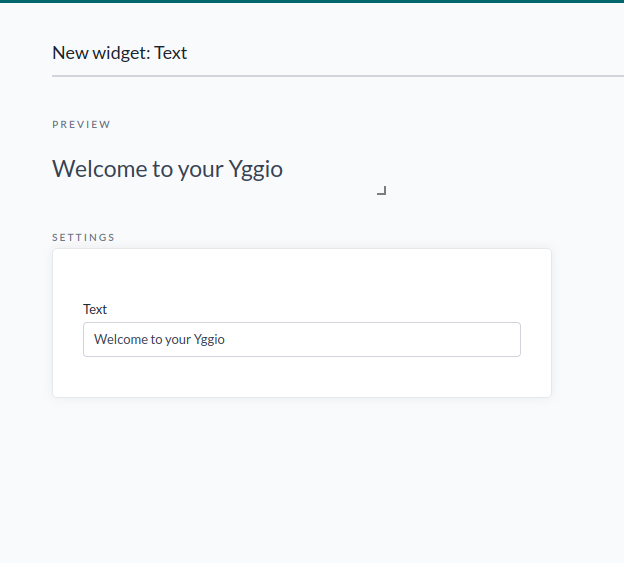
- Displays custom text.
Images
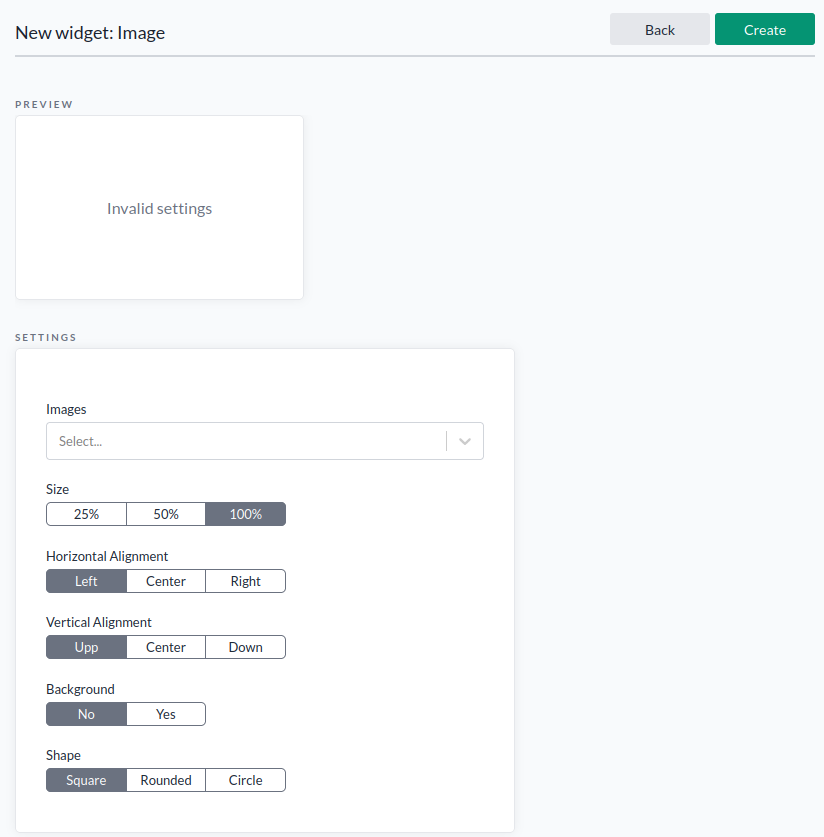
- You can select which images you want to add. [(HOW TO ADD AN IMAGE OF CHOICE)]
- You can edit the size, horizontal and vertical alignment, choose whether to include a background, and set the shape to Square/Rounded/Circle.
Edit Widgets
- Press the button and move your widgets as you like. Press the cog wheel in the corner to remove or edit your widgets. When finished, press Update. When done, press "Exit Edit Widgets Mode".
Duplicate a Widget
- Press the cog wheel in the corner and select Duplicate. This will create a copy of the widget. You can then move it to another location.
Manage Dashboard
- Manage Dashboard allows you to rename the dashboard. Users can be given access rights: admin, write, read, and peek. For more details, see Access Rights. It's possible to delete the dashboard by pressing Delete. When finished, press "Done".