Map
The Map page shows your devices where they physically are. Devices need a position before they appear - see Add device to map.
Putting devices on a map answers questions a list cannot. A value that looks like an outlier in a table is often a pattern on a map: one wing of a building, one side of a street. The clearest example is network coverage, where the radio conditions at each device are drawn as colours over the real geography.
From the map you can:
- Filter which devices are shown by name, device model name, type, DevEUI, connector, gateway, contextual parameters, or a custom query.
- Show or hide devices, locations, and geofences.
- Configure what device values are displayed next to each device icon, with colour thresholds.
- Separate the devices that have reported recently from the ones that have gone quiet.
- Save and manage map views to return to a specific configuration later.
- Share or export map views.
- Select multiple devices to perform bulk actions.
- Create and manage geofences.
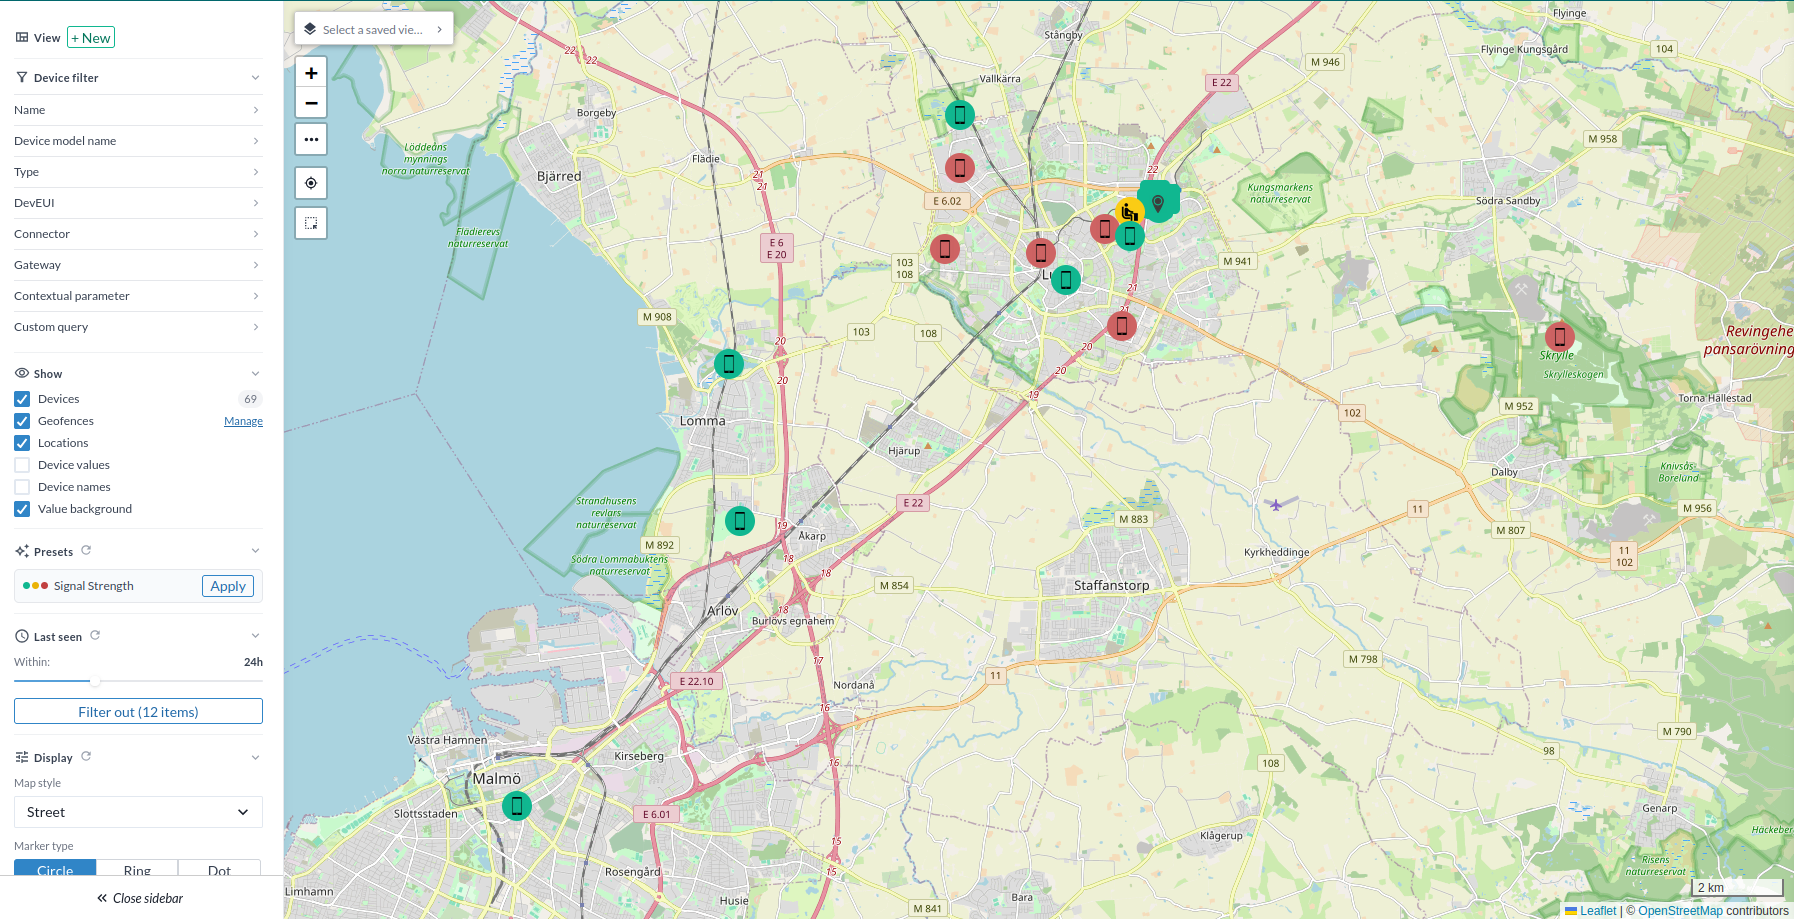
Sidebar
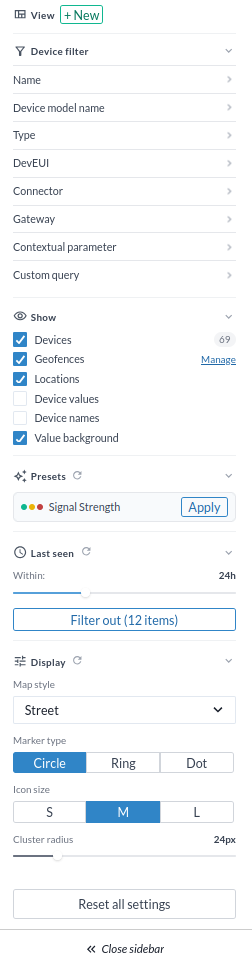
View
Switches between saved map views, and creates or edits one from the current settings.
Device filters
Narrow the map to the devices you want to look at. A map of everything is rarely the useful map - most work here starts by cutting it down to a site, a model or a connector.
- Name: Filters devices by name. Enter a string that the device name must contain.
- Device model name: Filters by the device model, so one hardware model at a time.
- Type: Can be Device, Connector, or Gateway.
- DevEUI: Unique identifier for LoRaWAN devices.
- Connector: The connector of the devices to display. Useful for isolating one network server's devices when its coverage is in question.
- Gateway: The gateway of the devices to display.
- Contextual parameters: Filters on a key-value pair in the device's contextual parameters - building, floor, customer, whatever you recorded at installation.
- Custom query: Filters on the device's own values, for conditions the fields above cannot express.
Show
Controls which elements are visible on the map. Each item can be toggled on or off.

- Devices
- Geofences
- Locations

- Device values: Prints up to five of the device's own values beside its icon, so the map carries readings and not just positions. Colour thresholds mark when a value crosses a limit, and a value marked with the star also colours the device icon. Values are configured in the view editor, or filled in by a preset - see Creating or editing a map view.
- Device names: Prints the device name beside its icon.
- Value background: Draws a panel behind those values so they stay readable over satellite imagery.
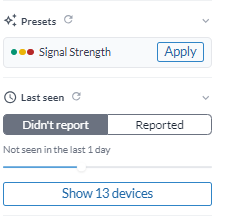
Presets
A preset fills in a whole set of device values and colour thresholds in one click, instead of configuring them by hand in the view editor. Applying one also puts a legend in the corner of the map, so the colours can be read without opening the sidebar. The reset icon in the section header clears it again.
There is currently one preset, Signal Strength. It is the basis of the network coverage map.
Last seen
Splits the devices into the ones that have reported within a period and the ones that have not, and puts either group on the map on its own.
- Didn't report or Reported - which of the two groups to show.
- The period below the toggle: 2 hours, 6 hours, 12 hours, 1 day, 1 week, 1 month, 6 months, 1 year or Never. The default is 1 day. Never is only offered under Didn't report.
- Show N devices applies the filter. The button then reads "Showing N - show all" to switch it off again. The count is worked out on the server, so it covers your whole estate rather than only what is currently drawn.
- The reset icon in the section header returns it to Didn't report / 1 day and clears the filter.
At most 10,000 devices are drawn on the map, and the section says so when the filter matches more.
For toggling between the two groups to find where devices have gone quiet, see Devices that stopped reporting.
Display
| Map style | Description | Image |
|---|---|---|
| Street | Highlights streets and road networks. | 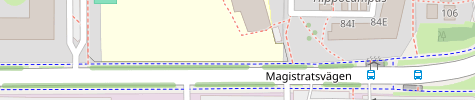 |
| Satellite | Composed of satellite imagery. | 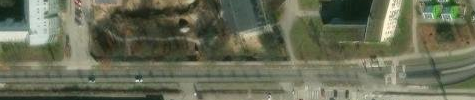 |
| Humanitarian | Displays infrastructure relevant to disaster response, public health emergencies, and refugee crises. | 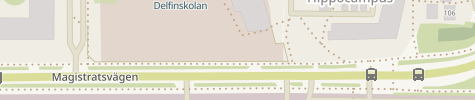 |
| Topo | A two-dimensional representation of terrain using contour lines, natural elements, and man-made structures. | 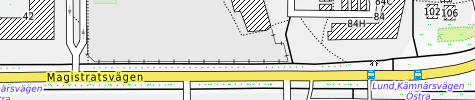 |
| Esri Street | A street map provided by Esri. | 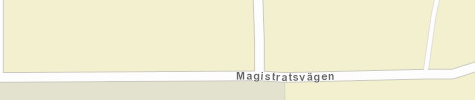 |
| Esri Topo | A topographic map provided by Esri. |  |
| Esri Gray | A grey-toned map provided by Esri. Has a more limited zoom range than the other styles. | 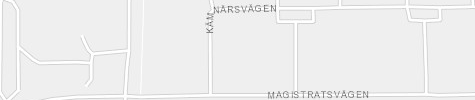 |
Marker type: How each device is drawn. Circle, Ring or Dot.
Icon size: S, M or L. Small keeps a dense site readable; large makes the colours legible on a wall screen or in a dashboard widget.
Cluster radius: How close two markers must be, in pixels, before they merge into one cluster. Between 10 and 80 px, 24 by default. Lower it to pull a dense site apart into individual devices; raise it to see a whole city as a handful of clusters.
Reset all settings: Resets all display settings to their defaults.
Close sidebar: Closes the sidebar.
Network coverage
The Signal Strength preset turns the map into a LoRaWAN coverage map. Every device is coloured by how well it is reaching the network. A weak spot then shows up as a red patch on a street, rather than as a row in a table.
It answers two questions at the same time: how good the radio link is where each device sits, and which devices have stopped reporting altogether.
Build the coverage map
- Narrow the devices to the site you are looking at, under Device filters.
- Under Presets, press Apply on Signal Strength. The legend appears in the corner of the map and the markers take their colours.
- Under Show, turn on Device values to print the three numbers beside each icon. The icon colours work without it, so leave it off when the map is crowded.
- Under Display, set Icon size and Cluster radius for the zoom level you are working at.
- Save it as a map view, so the whole configuration is one click away and can be exported or shared.
What the colours mean
The preset sets three values, each with its own thresholds:
| Value | Green | Yellow | Red |
|---|---|---|---|
rssi | above -110 | above -120 | below -120 |
snr | above 5 | above 0 | below 0 |
spreadingFactor | below 9 | below 10 | above 9 |

- RSSI is the received signal strength, in dBm. It is negative, and closer to zero is stronger.
- SNR is how far the signal stands above the noise, in dB. LoRaWAN still decodes below zero, but with no margin left.
- Spreading factor is how slowly the device had to transmit to be heard. A higher spreading factor means more airtime per message, fewer messages per day and shorter battery life.
Read the three together. A device on SF7 with a strong RSSI has headroom. One on SF12 is already using everything it has, so a small change - a door kept closed, a cabinet fitted around it - can push it off the network.
The marker itself is coloured from all three values combined, not from RSSI alone. So the marker is the verdict and the numbers beside it are the detail. The values arrive from the network server with each uplink, and are listed per device under Connectivity in Data.
The legend can be collapsed, and clicking a colour hides that group. Both work from the keyboard too: tab to the legend or a colour and press Enter or Space. Hiding green leaves the problem devices on the map on their own.
Devices that stopped reporting
Colour only covers devices that are still reporting. Last seen covers the rest.
Left on Didn't report, the map shows only the devices that have gone quiet within the period. Switched to Reported, it shows only the ones still arriving. Toggling between the two is the quickest way to see where the silent devices are. One on its own usually points at that device; a cluster of them in the same area points at the gateway covering it.
A device that has stopped reporting keeps the last values it sent, so its marker still shows what its signal was doing before it went quiet.
Add device to map
A device appears on the map once it has a position. A GPS-enabled device sets its own and moves by itself; everything else is placed by hand, and is worth placing even if it never moves.

- Go to the device's page in the Devices tab.
- Click the Position tab in the device sidebar.
- Set the position by clicking on the map, entering coordinates manually, or clicking the compass button to use your current location.
- Click Save to save the device position.
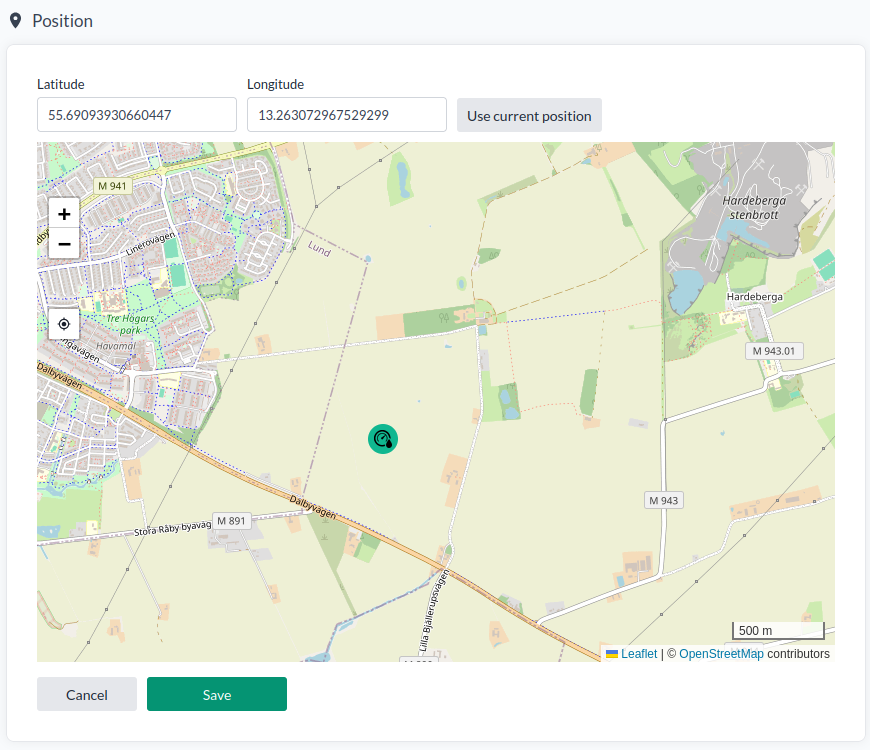
Devices can also be repositioned from this map, which is usually faster when placing several in the same area. See Position for the same tab on the device itself.
Map views
A map view saves the whole state of the map under a name, so a configuration you have worked out once is one click away afterwards.
A map view saves:
- The device filters
- The show/hide state for devices, locations and geofences
- The device values and their colour thresholds, including a preset you have applied (see Device values)
- Whether device values, device names and the value background are shown
- The Last seen mode and period
- The map style, marker type, icon size and cluster radius
- The start position: the centre and zoom level the view opens at
So a coverage view for one site and an overview of the whole estate can each hold their own filters, zoom and marker settings.
Selecting a map view
- Click the Views dropdown in the sidebar.
- Select the view to use.
Creating or editing a map view
- Go to the Map page in the control panel.
- Open the sidebar.
- To create a new view, click the + New button.
- To edit an existing view, select the view from the dropdown, then click the cogwheel button.
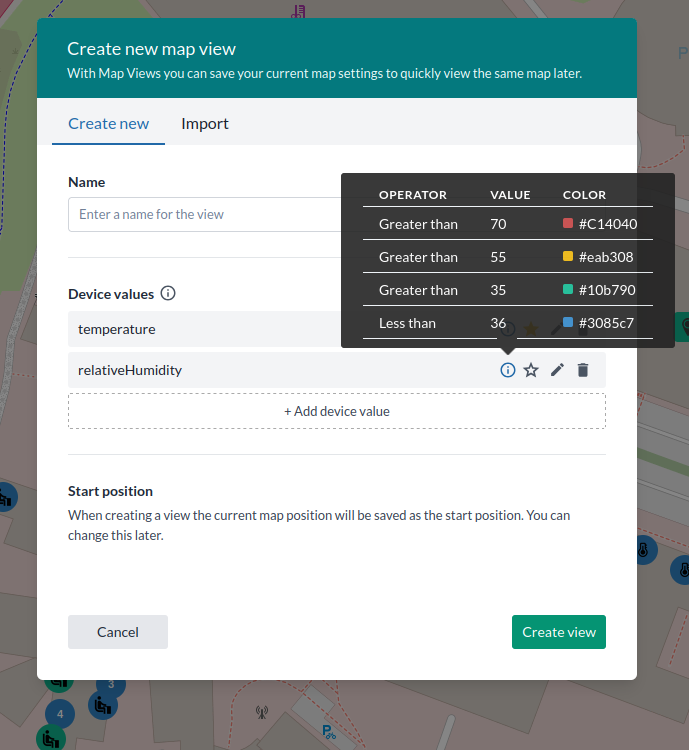
- Enter or update the view name and optionally configure device values. The current device filters and show/hide settings are saved with the view. The current map position is saved as the start position.
| Parameter | Description |
|---|---|
| Name | The name of the view. |
| Device values | The device fields to display next to the device icon. If the star icon is enabled for a value, the configured threshold color is applied to the device icon. A value needs at least one rule before it can be starred. Click the pen icon to reconfigure a value. |
-
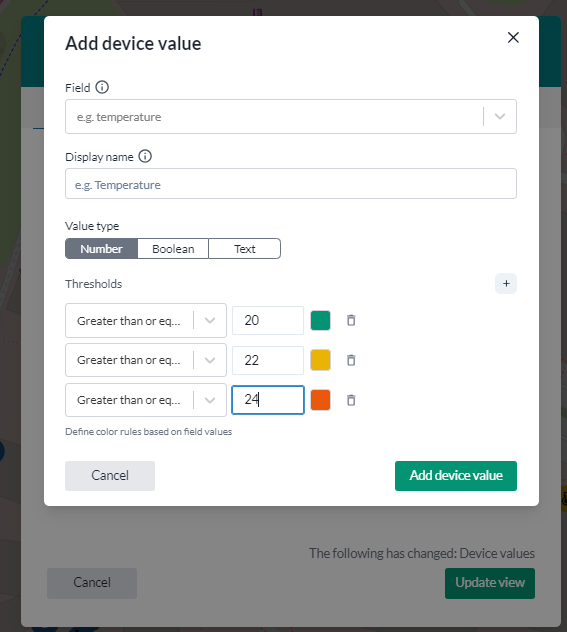
To add or reconfigure a device value, click the pen icon next to an existing value or click Add device value.
- Field is the field to display. The dropdown lists the fields found on the devices, and you
can type one that is not offered. Field names are the internal ones listed in the device's Data
tab, for example
temperatureorhumidity.outside. - Display name is the label shown beside the device icon. Left empty, the field name is used.
- Value type is Number, Boolean or Text. Switching it clears the rules already entered, because the three kinds take different rules.
- Unit, for a Number, is shown after the value, for example
°C. Picking a standard Yggio field such astemperatureorco2fills it in for you. You can change or clear it. - The rules themselves. For Number, each is a condition - Greater than or equal, Greater than, Equal, Less than or equal, Less than - then a value and a colour. For Boolean, each is true or false and a colour. For Text, each is an exact value, the text to show in its place, and a colour.
When a device's value matches a rule, the value is printed in that colour. If the value is starred, that colour goes on the device icon as well.
Click Done or Add device value when finished.
- Field is the field to display. The dropdown lists the fields found on the devices, and you
can type one that is not offered. Field names are the internal ones listed in the device's Data
tab, for example
- Click Create view or Update view to save.
Create a view with an export string
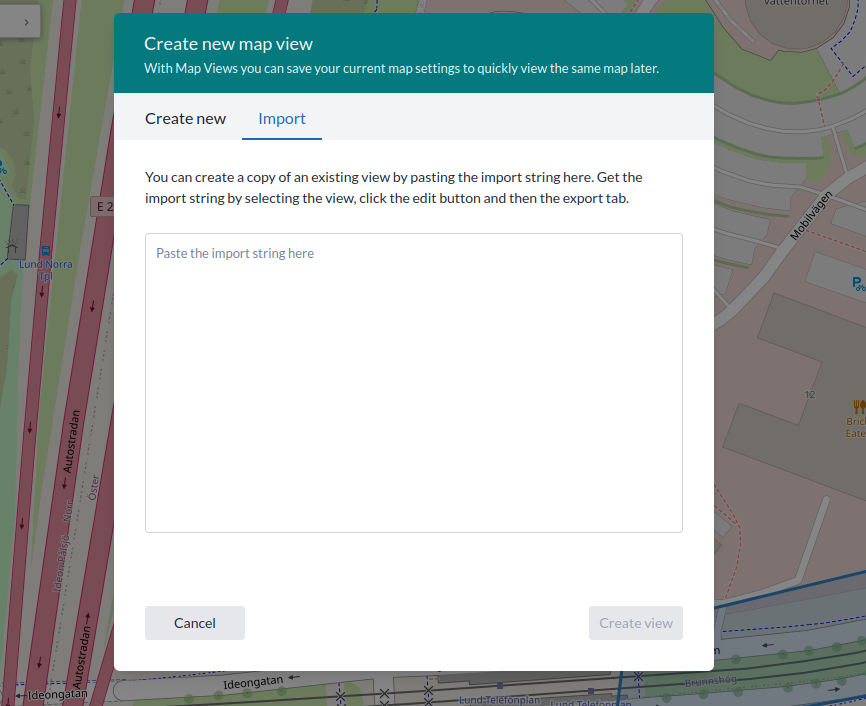
Paste an export string here. Export strings are generated from an existing view as described below.
Map view edits options
Update
Changes the name and the device values of the view, and re-saves the current filters, show/hide settings and map position onto it. Same editor as Creating or editing a map view.
Export view
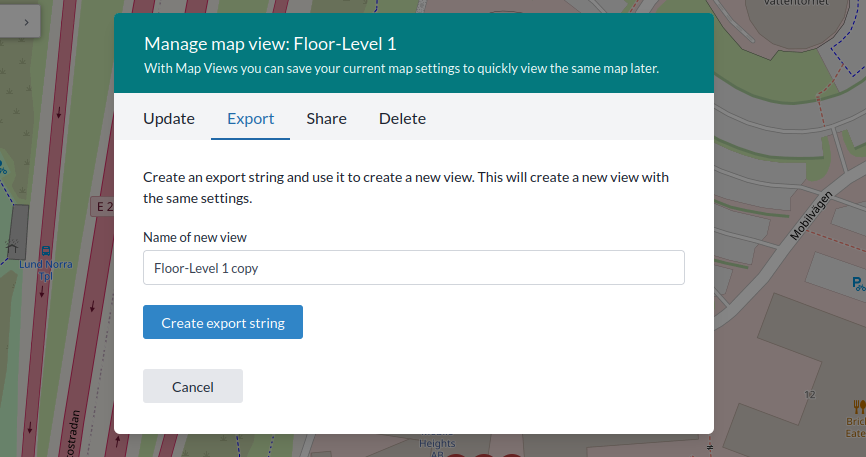
Click Create export string to generate an export string. The string can then be copied and pasted when creating a new view (see above).
This is how a view built once reaches other people: work out a good coverage map, export it, and hand the string to whoever needs the same picture.
Share view
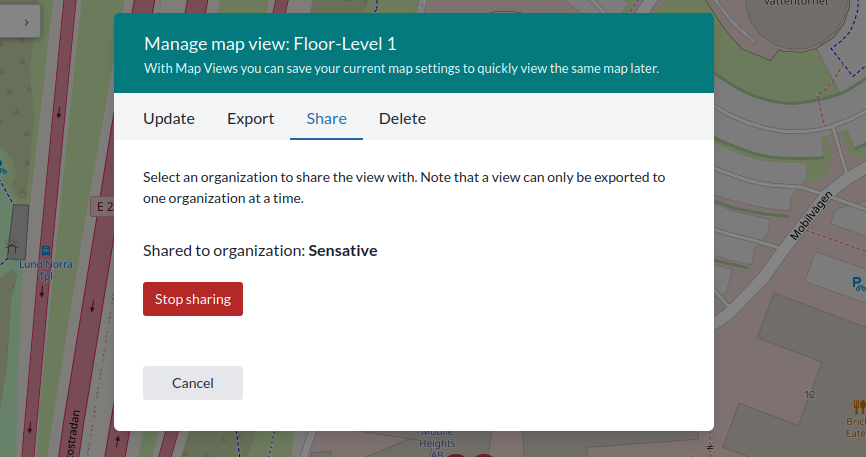
Shares a view with an organization, so everyone in it has the view without importing anything. One organization at a time.
Delete view
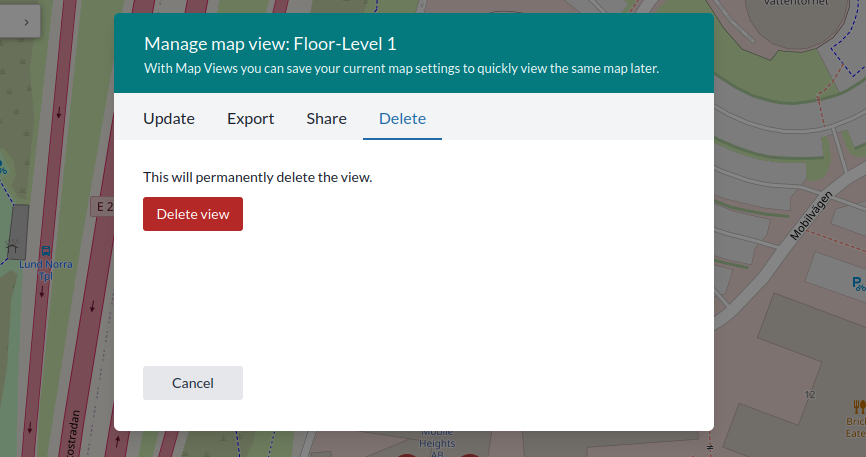
Permanently deletes the view.
Maps in dashboard
Saved map views can be displayed as widgets in the dashboard. Create a new Map widget and select a map view. See the Map widget for what the widget itself offers.
Select many
Acting on devices by where they are, rather than by what a filter matched. Picking the red markers in one corner of a site and synchronizing them is a selection that is hard to build from a list.
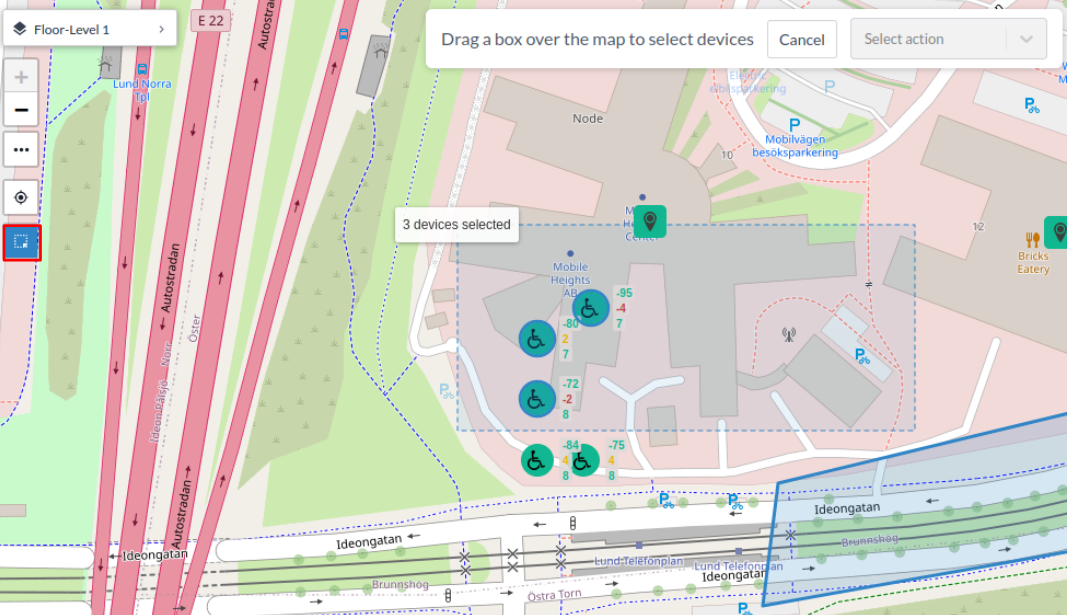
- Click the highlighted button to enable multi-select mode.
- Click the devices to act on. Hold Shift while clicking to add to the selection.
- Pick an action: Access rights, Add device to group, Charts, Configure, Edit or Synchronize.
For a description of each action, see Select many.
Geofences
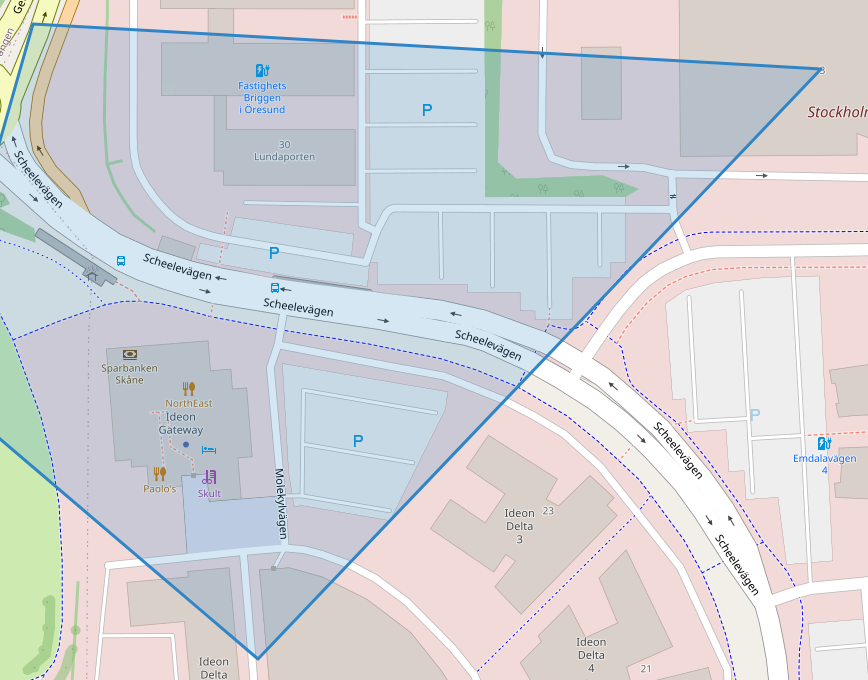
A geofence is a virtual perimeter around a real-world area. A device entering or leaving one raises an event, which the rule engine can act on.
You can also run a geoquery to identify devices within a geofenced area or a custom area defined by the query.
As of Yggio v3.39.9 you can draw a geofence directly in the map.
Create a geofence with the map
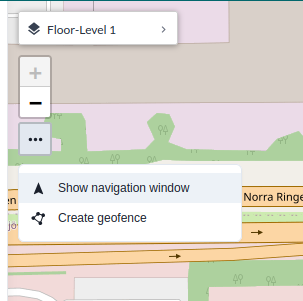
- Click the button with three dots and select
Create geofence.
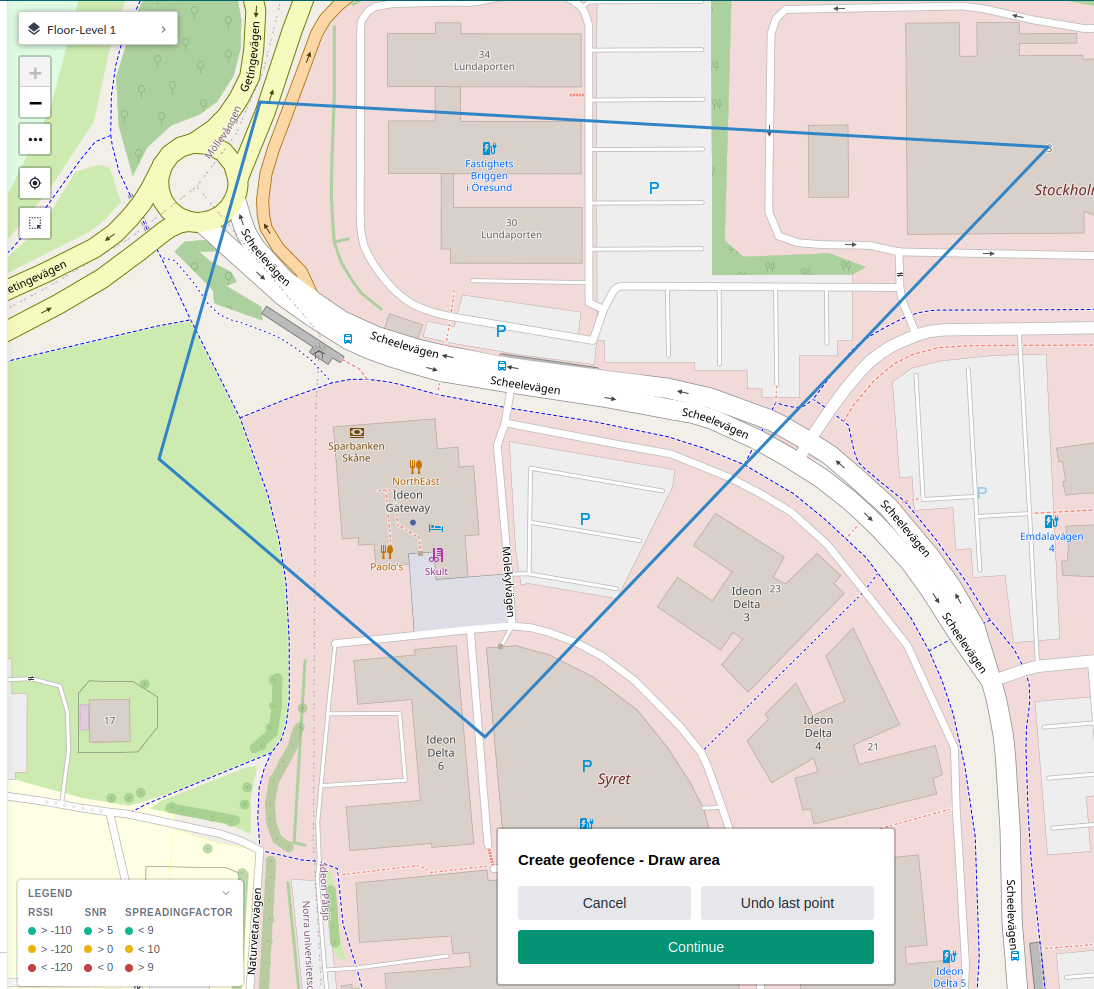
- Click on the map to draw the geofence boundary. When done, click
Continue. You can also undo the last point.
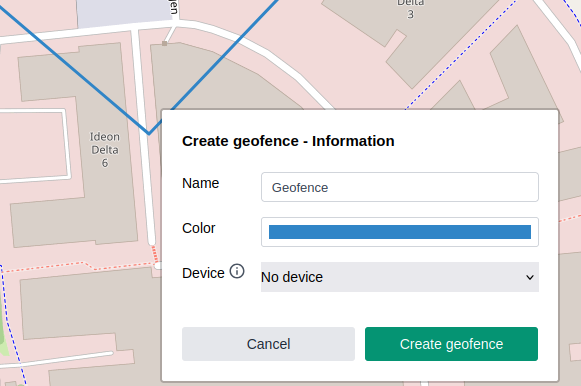
- Enter a name, a color, and optionally a device to be moved to the center of the geofence. Then click
Create geofence.