Logs
The Logs page is the account's event history: device reports, alarms, downlinks, access rights changes and edits, newest first.
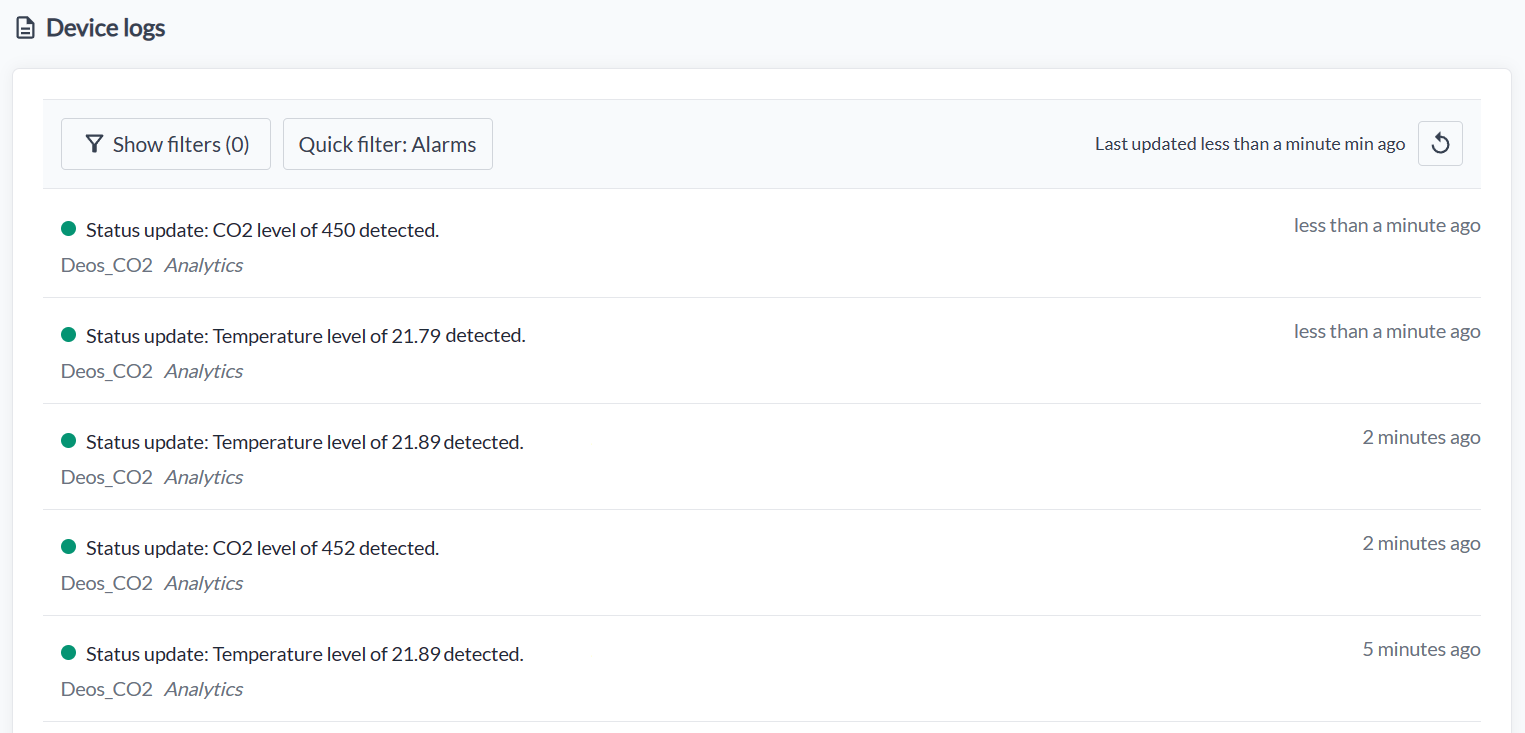
The same list appears on a device's own Logs tab, narrowed to that device, and in the Logs widget on a dashboard. The widget takes the same filters and the same time display, so anything you can pick out here can be put on a dashboard and left up.
Reading an entry
| Part | What it tells you |
|---|---|
| The coloured dot | The entry's type - error, warning, info, debug or verbose |
| The message | What happened |
| The resource | The device or other resource it happened to. Click it to see only that device's logs |
| The category | Which kind of event it is |
| The priority pill | Shown on unacknowledged entries above low priority |
| The time | In the format set by Time display |
An acknowledged alarm carries [Acknowledged by: <username>] after its message, so you can see who
dealt with it.
A change to a device's contextual parameters names who made it and the value before and after, for
example nick changed contextMap.setValue from '21' to '23'. A key that was added or removed shows
unset on the empty side. When many keys change at once, the entry ends with (+N more) for those
that did not fit.
Alarms
An alarm is an unacknowledged log entry of high or severe priority. It is not a separate kind of entry and not a category - it is those two properties together.
Three controls handle them.
Quick filter: Alarms is a toggle on the toolbar. It clears the other filters and sets priority to high and severe, unacknowledged. Press it again to clear.
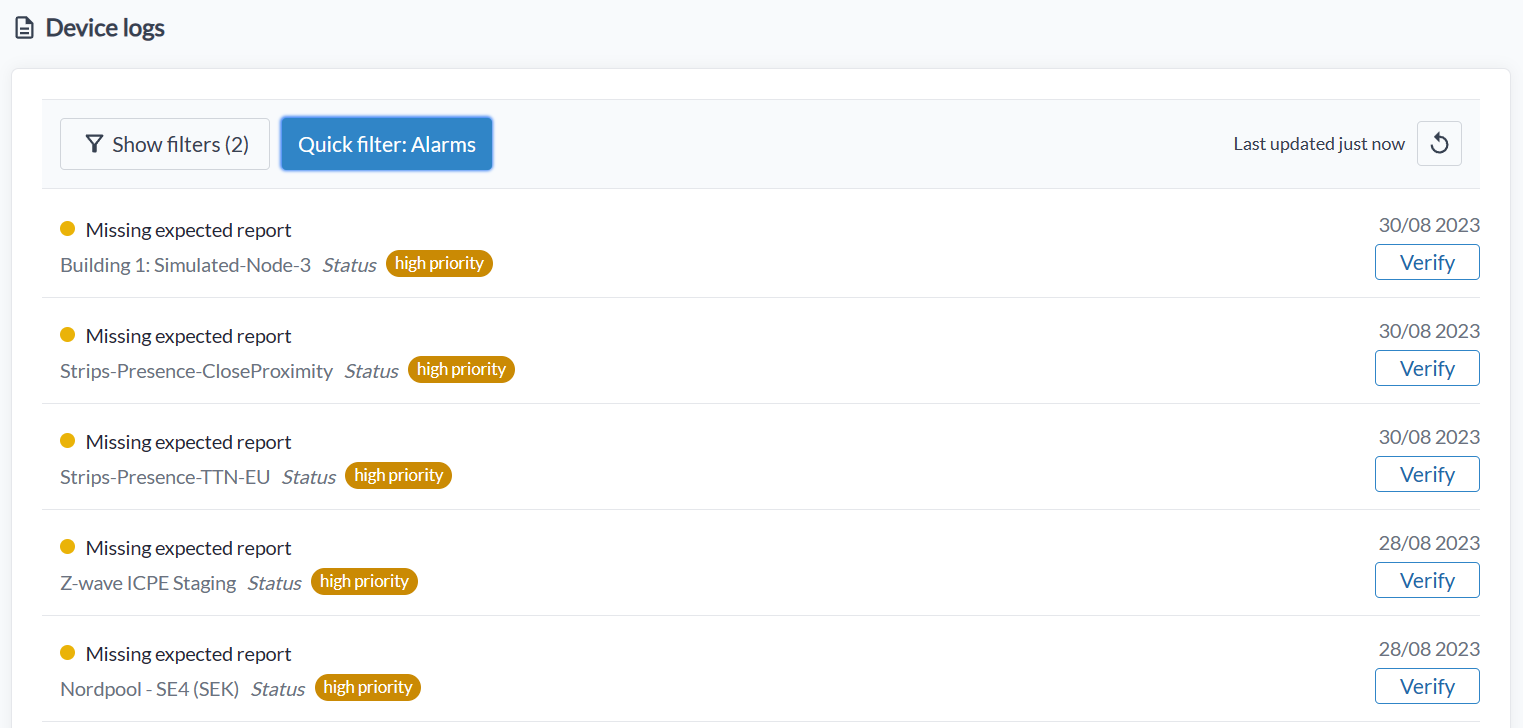
Acknowledge appears on a high or severe entry that has not been acknowledged. Acknowledging records your username against it and takes it out of the alarms filter. Unacknowledge puts it back.
Acknowledge all clears every unacknowledged alarm in one go. Opened from a device's own Logs tab it is scoped to that device, so acknowledging one device's alarms no longer clears the account's.
Note: an alarm has to be acknowledged before the same alarm can be raised again. Left unacknowledged, it will not trigger a second time. This is also why the Missing expected report trigger in the rule engine fires once rather than repeatedly.
Filters
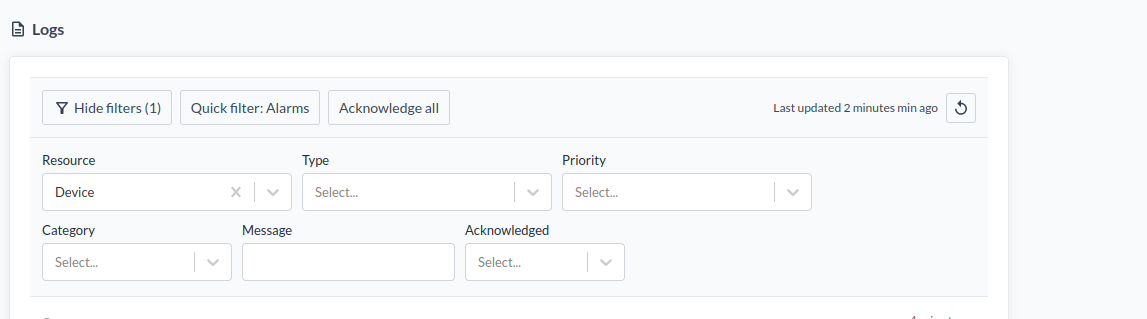
Show filters opens the filter panel and carries a count of how many filters are active. Clear filters empties them again.
| Filter | |
|---|---|
| Resource | The kind of resource: Device, Organization, User group, Connector or Rule. All by default |
| Type | One or more of Error, Warning, Info, Debug, Verbose |
| Priority | One or more of Severe, High, Medium, Low |
| Category | One of Access, Analytics, Command, Rule, Status, System, Update |
| Message | Free text, matched against the message |
| Acknowledged | Acknowledged or Unacknowledged |
| Time range | The period to show |
Type and Priority take several values at once. The rest take one.
Type
| Type | What it means |
|---|---|
| Error | A detected error - a command that got no response in time, a device that failed to report |
| Warning | Something worth attention, such as weak signal or a sensor event. Read the priority to judge how much |
| Info | An ordinary informational entry |
| Debug | Developer-facing messages, including translator crashes |
| Verbose | Status messages from integrations, for example a LoRaWAN network server. Useful for watching network quality |
Debug and Verbose are off the beaten track for everyday use, and they are the two worth knowing about when something is wrong. Debug is where a crashed translator reports itself, and Verbose is where the network server says what it is doing with a device.
Priority
| Priority | |
|---|---|
| Severe | A critical event needing immediate attention - a fire or explosion risk, say. Triggers a notification |
| High | A serious warning needing prompt action. Triggers a notification |
| Medium | An action may be needed, but it can wait. No notification |
| Low | Nothing to act on. No notification |
High and severe are also what make an entry an alarm.
Category
| Category | What it covers |
|---|---|
| Status | General events: alarms, state changes, external errors |
| Update | Node update events |
| Command | Downlinks |
| Access | Access rights events, for example account X granted read access to user Y |
| Analytics | Device updates as new data arrives |
| Rule | Rule engine events, including the Write log action |
| System | Platform-level messages, including translator crashes |
When a translator crashes
A translator that throws while decoding a payload writes a log entry against the device it was decoding. This is the only place that failure is reported - the device simply carries no decoded values, and nothing else says why.
Find them with Type: Debug and Category: System. The entry names the translator and its version and carries the error:
Translator "milesight-am319" (v2.1.0) error: Cannot read properties of undefined (reading 'length')
The error text is cut at 400 characters, and the entry is written at medium priority against the device, so it is also on that device's own Logs tab.
Note: these entries are kept for six hours. The Debug retention rule is shorter than the System category's, and the shorter one wins. Copy out what you need the same day.
Three things account for most of these:
- the device is sending a payload the translator was not written for;
- the translator's version does not match the device's firmware;
- the device has the wrong translator on it.
Time range
Off by default, so the list covers everything. Switch it on and pick a period.
Ready-made periods are the last 15 minutes, hour, 6 hours, 24 hours, 7 days, 30 days and 90 days, and turning the filter on starts at the last 24 hours. A start and an end can also be set by hand, and All time turns the filter off again.
An end before the start is rejected rather than silently returning nothing.
Time display
Three formats, set beside the list controls rather than in the filter panel - this changes how entries are written, not which ones you see.
| Setting | Shows |
|---|---|
| Relative time | 5 minutes ago |
| Exact time | 11/09 2026 14:23:07 - 24-hour, to the second |
| Both | 5 minutes ago (11/09 2026 14:23:07) |
Relative time answers "is this current". Exact time is what you need the moment you compare Yggio against anything else: a network server's own log, a site visit, a report from whoever noticed the problem. Seconds matter when several entries land in the same minute and the order tells the story.
Both is the useful default while investigating, since it keeps the at-a-glance reading and the timestamp you can quote.
Keeping the list current
The list refetches itself every two minutes, and the note above it says when it last did. The refresh button beside it fetches immediately.
The footer sets how many entries appear per page - 5, 20, 50 or 100 - and pages through them.
How long entries are kept
Entries are deleted automatically. Retention is set by category, except for the two developer-facing types, which are set by type instead.
| Kept for | |
|---|---|
| Access | 10 years |
| Status, Command | 2 years |
| Update, Analytics | 1 year |
| Rule | 4 weeks |
| System | 14 days |
| Verbose (type) | 14 days |
| Debug (type) | 6 hours |
Translator errors are written as type Debug under the System category, so the 6-hour rule reaches them first. Copy anything you need out of a debug entry the same day.