System Overview
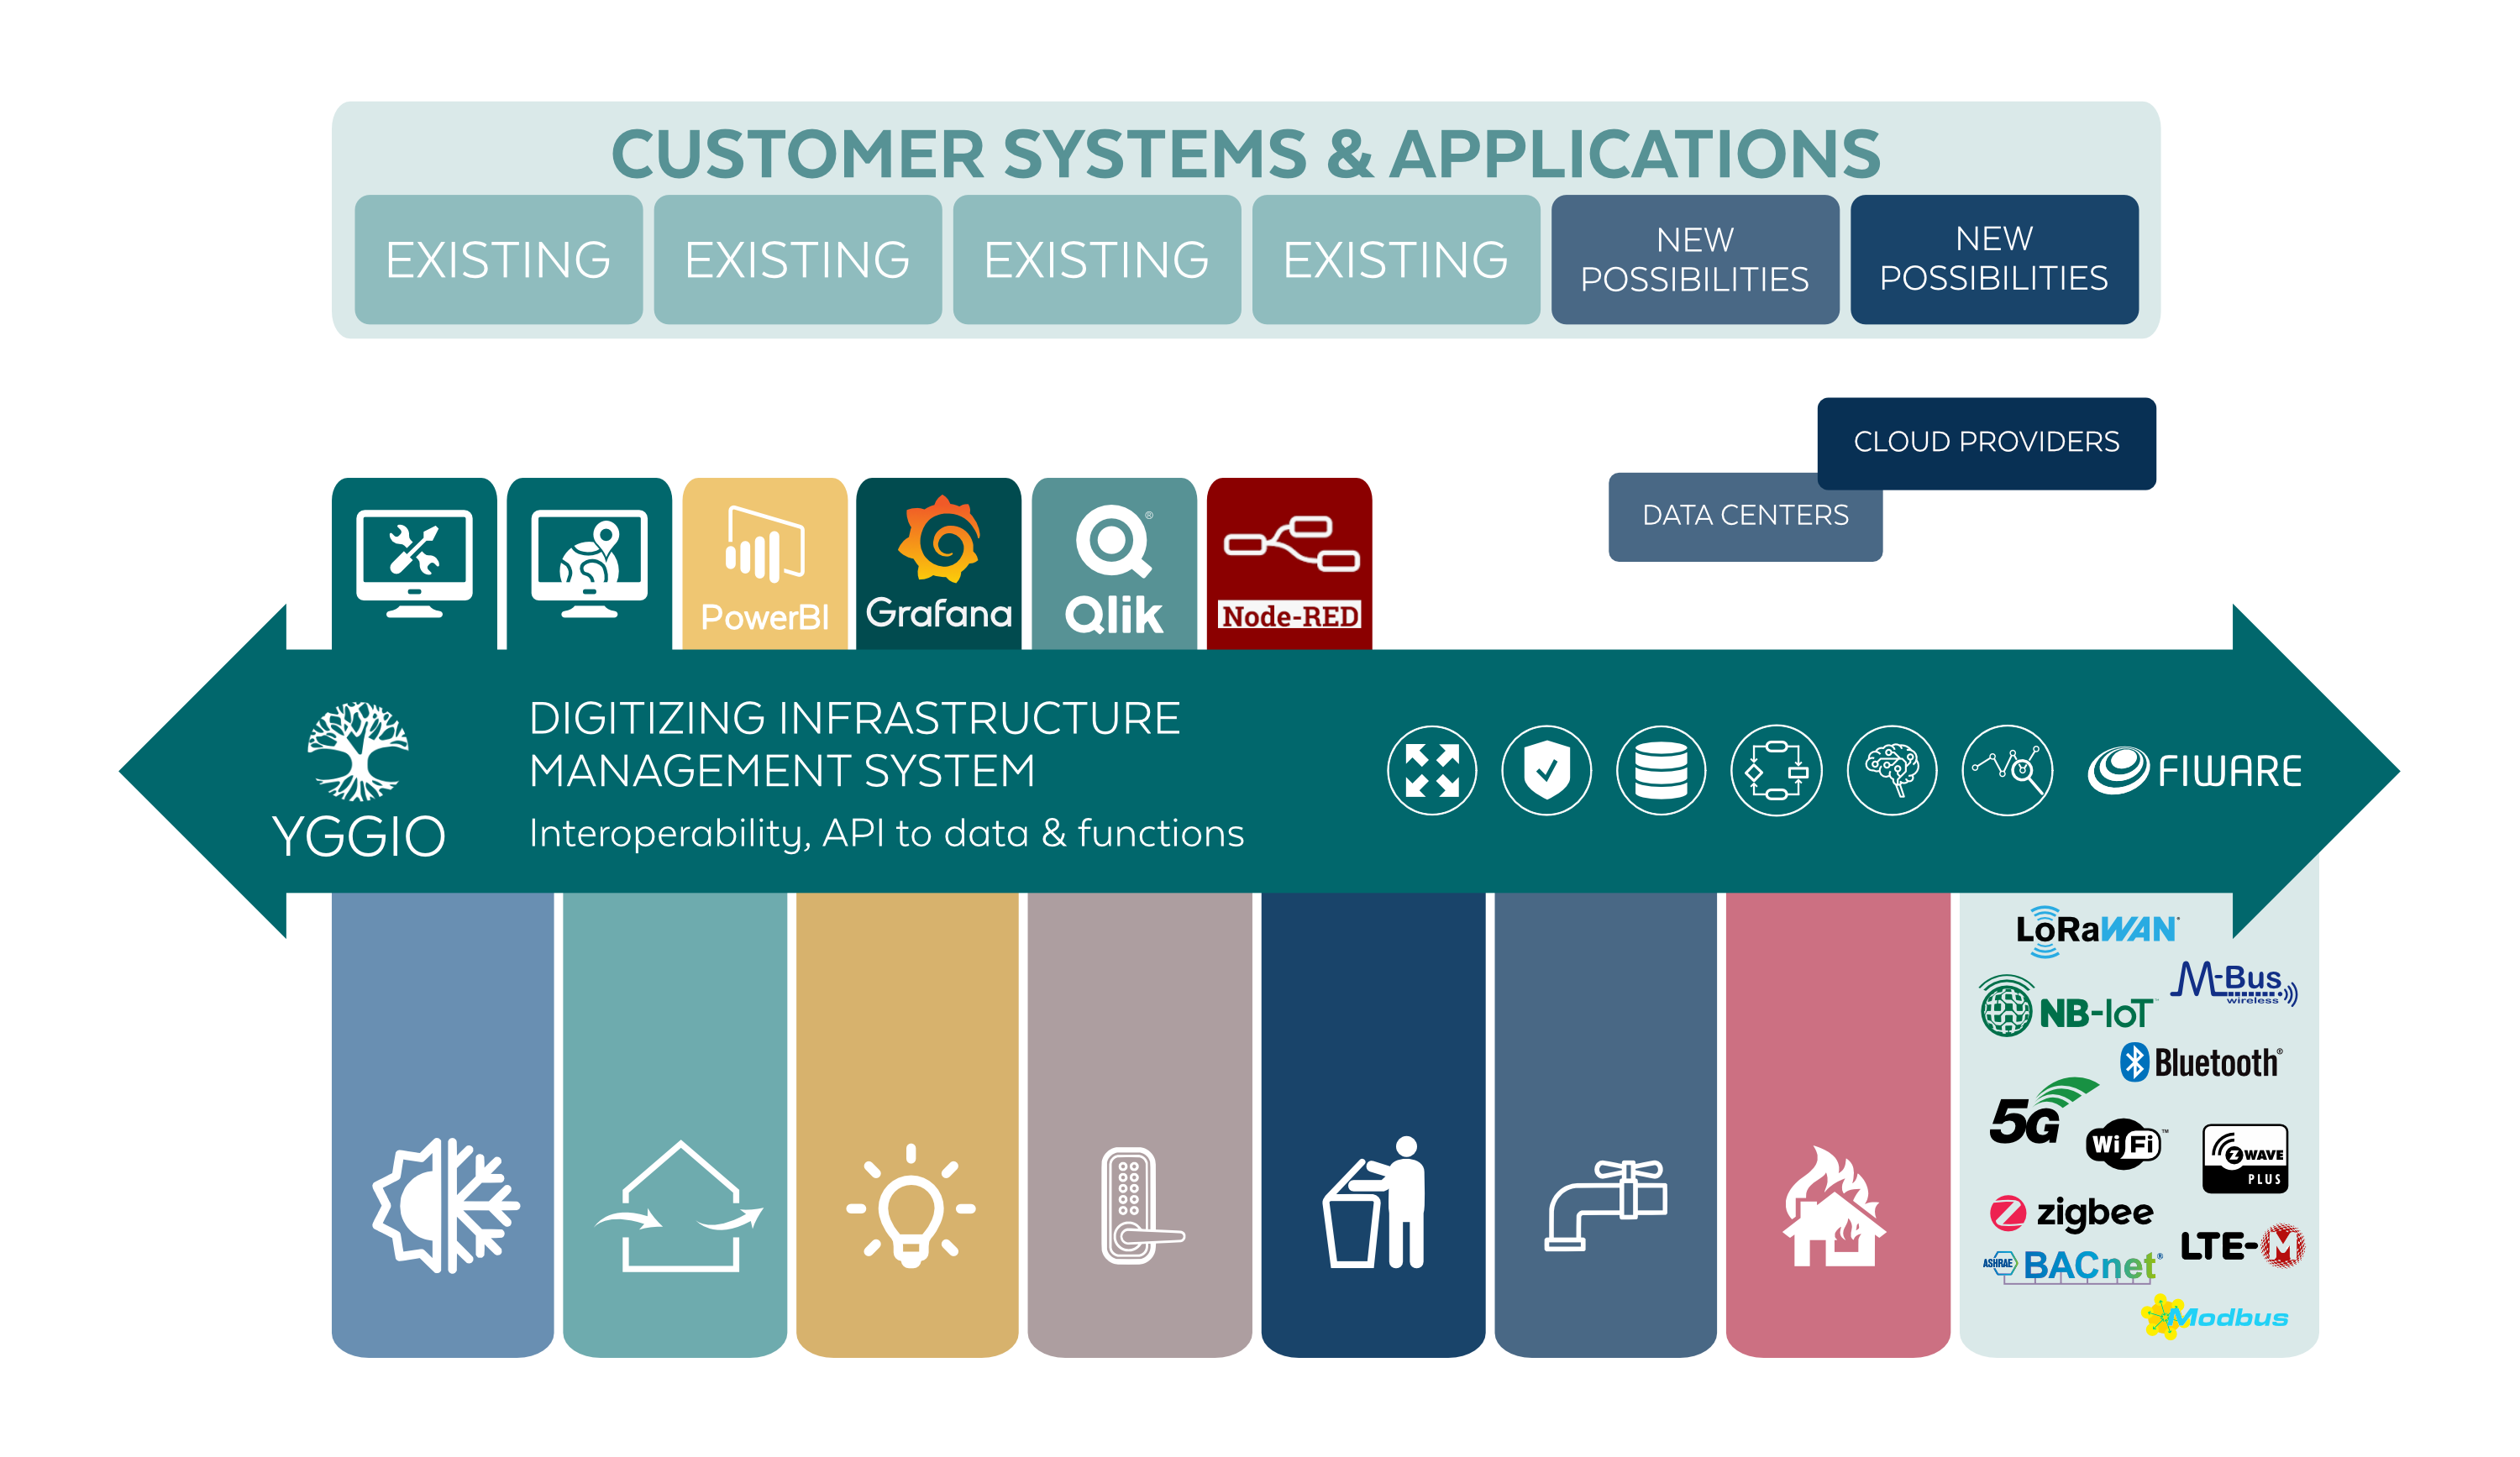
Yggio sits between devices and applications and acts as a data broker. Devices send in raw payloads over whatever protocol they use; Yggio decodes them, stores them, gives them a common shape, and serves them to applications through open APIs. Around that core it adds integration, visualization and enrichment, so a use case can often be delivered without building an application at all.
This page is a summary of the whole platform and links onward to the detail. For what Yggio does rather than how it is built, see the Introduction.
The Front End
The front end is built on state-of-the-art web technology and kept continuously fresh, with the foundation renewed as the technology moves rather than left to settle. That is what secures the pace of development: because the ground stays current, a new view, a new widget or an entirely new capability can be delivered quickly today, and will still be quick to deliver a year from now.
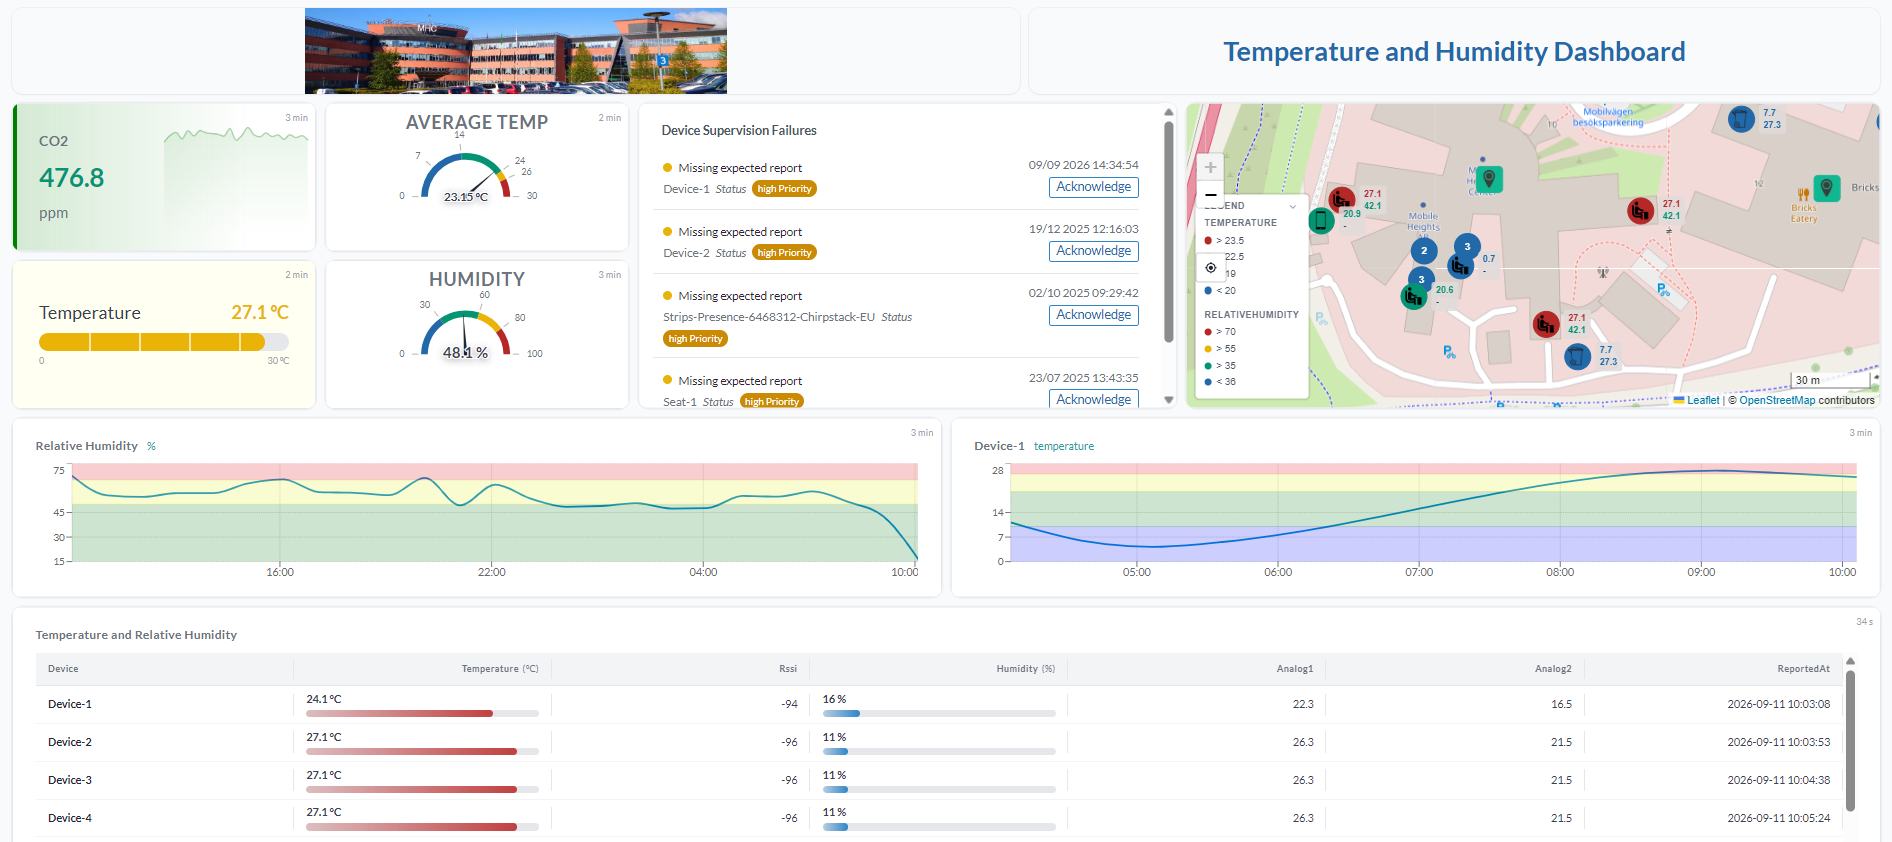
Dashboards
Widget-based dashboards, assembled by drag and drop, showing KPIs, charts and maps over incoming data. See the Dashboard guide.
Devices, Map and Views
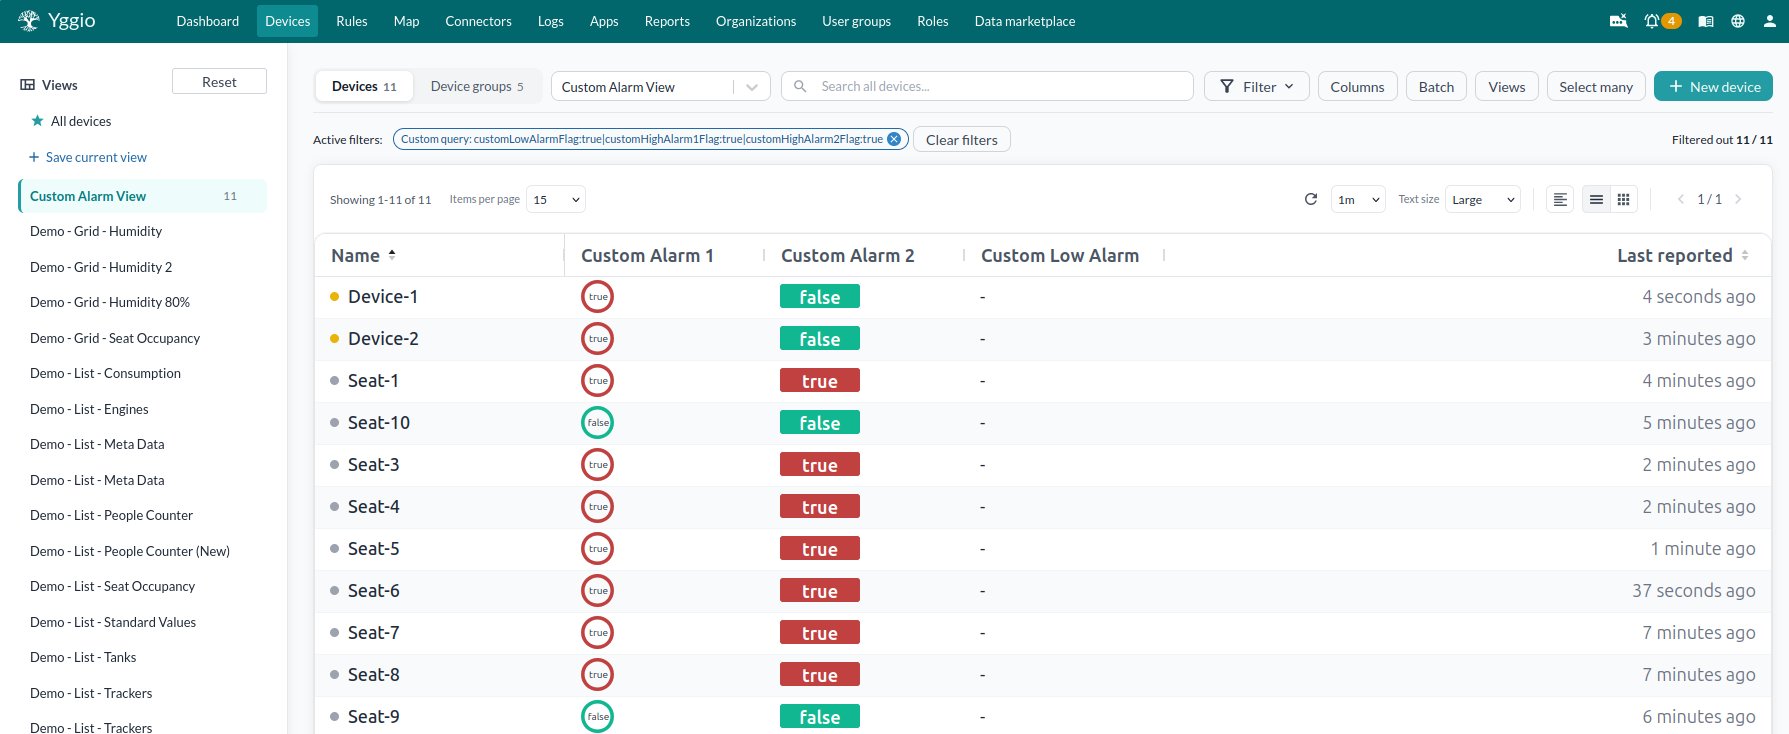
The device management interface. Views are built from filters using FIWARE Q queries, which match on attribute values rather than device names, so a view can be defined as "everything currently out of range" instead of a fixed list. The same query mechanism drives the map, where devices appear at their reported position and geofences detect entry and exit, and the alarm views below. One filtering concept, three presentations.
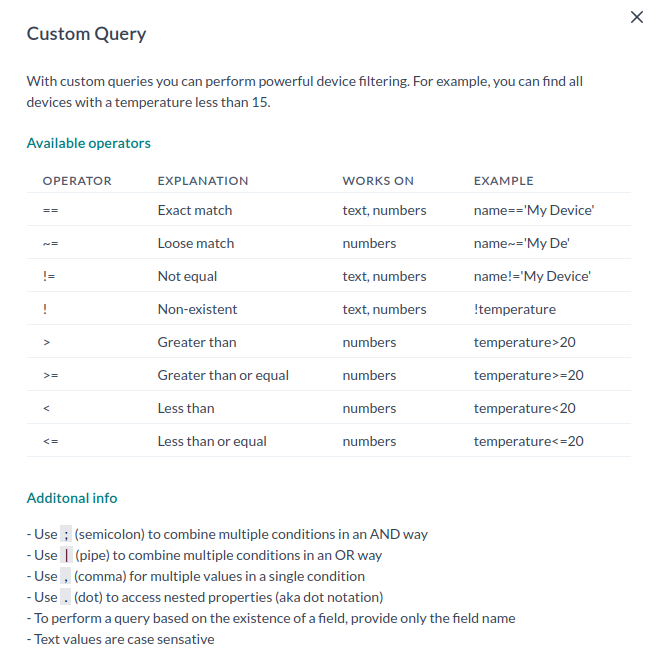
A FIWARE Q query filtering on a deviation.
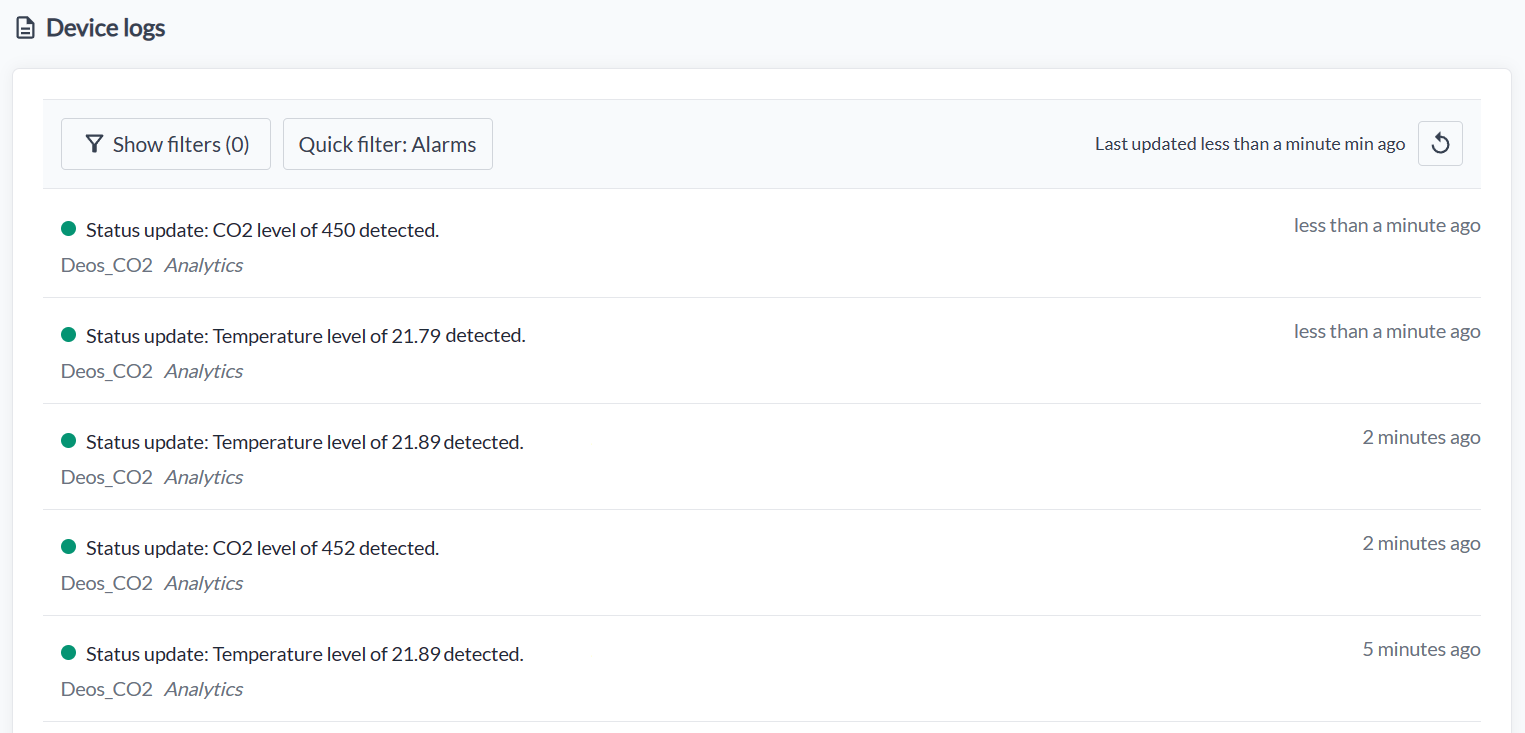
Alarms and Logs
Alarms in Yggio are first-class operational events, on the level an operator would expect from a SCADA system.
Every entry carries:
- Priority: severe, high, medium or low
- Type: error, warning, info, verbose or debug
- Category: update, command, status, access, analytics, rule or system
- Acknowledgement: who acknowledged it and when, so it is clear what has been dealt with and by whom. Entries can also be acknowledged in bulk
Logs are not limited to devices. They are kept for devices, connectors, user groups and organisations, so an access-rights change on an organisation or a user group is traceable in the same place and the same format as a sensor going out of range. Verbose and debug entries are hidden by default and shown on request, which keeps the operational view readable.
There are three ways to produce an alarm, and they can be combined:
- Assign an alarm translator. The ready-made ones supervise a field against thresholds set as translator parameters, applying hysteresis so a value sitting near a limit does not toggle the alarm repeatedly. See Alarm Translators.
- Write your own translator and upload it, when the condition is specific to your operation. See the Translator Development guide.
- Use the Rule Engine, defining the condition there and posting the result to the log with the "Log" action.
The Alarm Monitoring View is a device view filtered on alarm fields, giving the current state across the estate. See Logs.
Apps and Field Tools
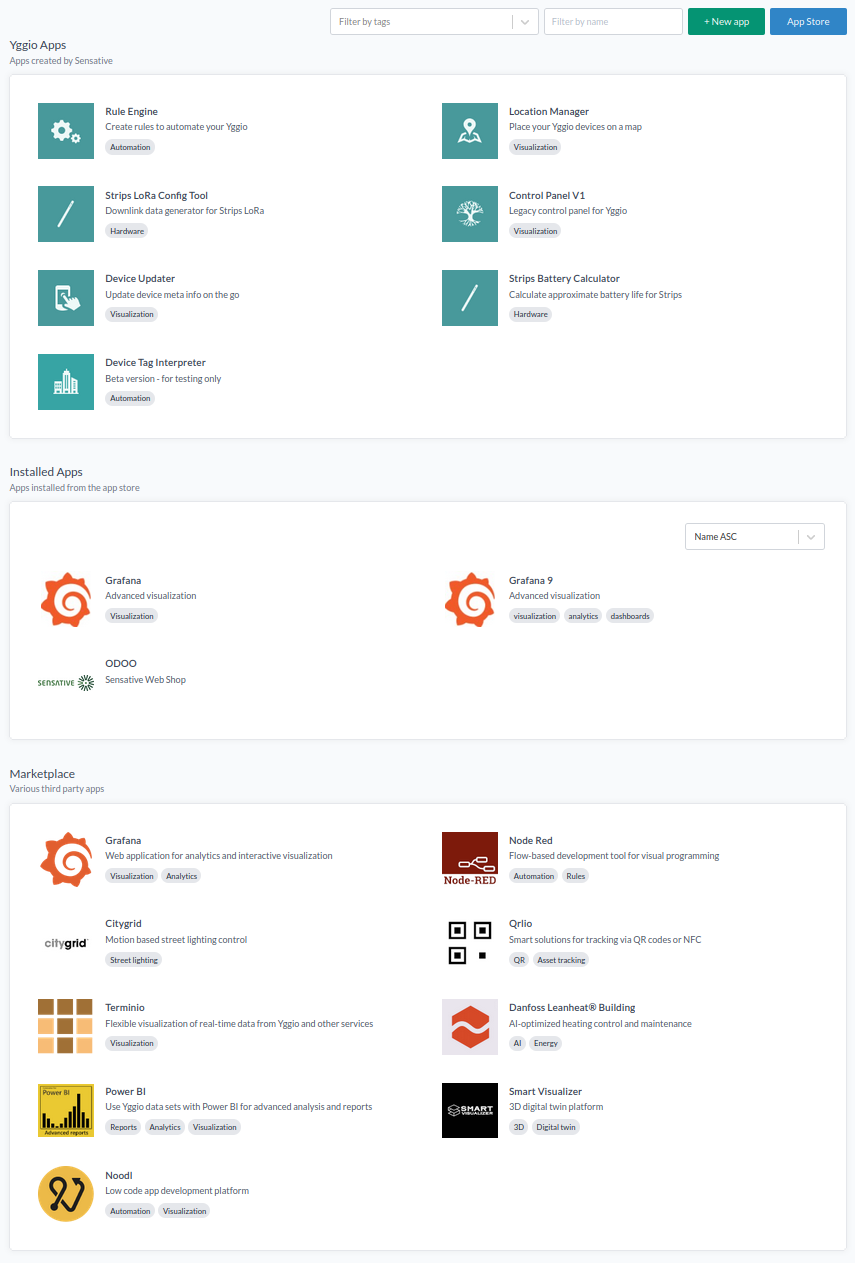
The Apps page hosts first- and third-party applications that store information, links and access rights and interact with Yggio data. They can be built with or without a backend of your own; see Get started with Yggio Apps.
Alongside them sit tools for the people who install and maintain the estate, such as the Device Updater, built for a mobile phone so an installer can update a device while standing at it.
The Backend
The backend is a set of stateless microservices, each responsible for one job and each scalable on its own. Because they hold no state between requests, instances can be added, removed or replaced without coordination, which is what makes the platform both redundant and horizontally scalable. Services communicate asynchronously over a message broker, and state lives in replicable databases rather than in the services themselves.
The Data Path
What happens between a device transmitting and an application reading the result, following the Default Flow:
- Arrival. The device's network server or gateway delivers the payload to the connector configured for that device.
- Entry through the Integration API. Integrations hand data to the Integration API rather than writing to storage themselves. This is where the entity is looked up or created, and where calibration is applied, so it is the raw reading that is corrected and no consumer sees the uncorrected figure.
- Translation. The Translator Service runs every translator on the node, chained, each seeing the output of the previous one.
- Calculations. Derived values are computed from the translated fields.
- Location Service. If the device's position has changed, it is updated, and geofence membership is evaluated where the flow includes it.
- Distribution. The result goes to the channels, the database and the Rule Engine together, so subscriptions fire, history is written and rules evaluate off the same update.
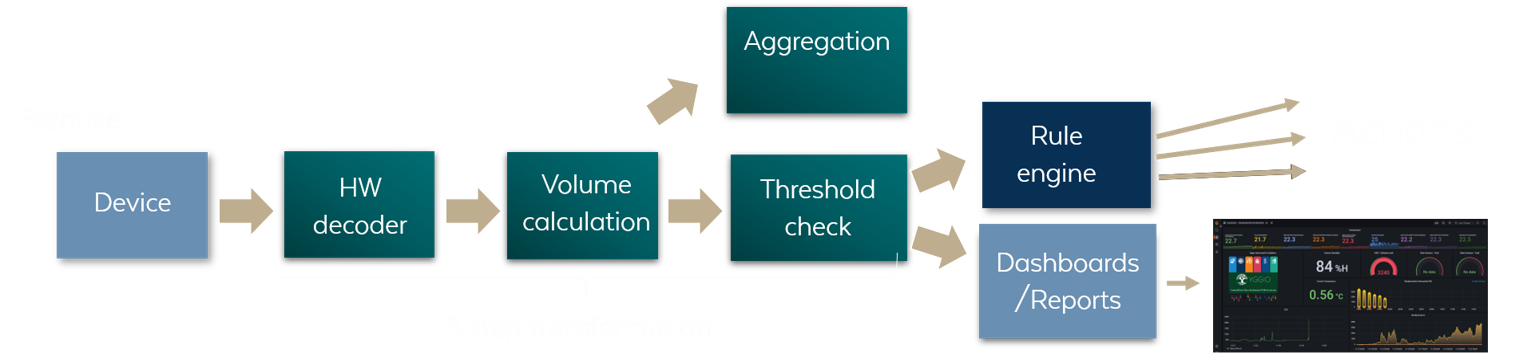
Because each step is a separate service, a slow translator does not block ingestion, and load in one part of the path scales independently of the rest.
Flows
The path above is not fixed. A flow is the set of instructions deciding which functionality handles an update, and four standard ones ship with the platform: Default, General Timer, General Geo Query, and General Timer and Geo Query. Timers allow a delay before an alarm triggers; geo queries evaluate whether a node is inside or outside a geofence, which is what most tracking use cases need.
Flows can also carry transform functions, custom code uploaded to the platform and executed inside the flow in a sandboxed environment, and they can bypass functionality entirely to store high-frequency data straight to the database. Each connector has a default flow, and the flow can still be assigned per device. See Data Flows, Timers and Geofences.
Integration API
The Integration API, historically also called the Lens, is the layer that sits directly on top of the database. Everything else in Yggio goes through it rather than reading or writing storage itself, which is why it is the component that enforces how an entity is created, calibrated, translated and updated no matter which integration or API the data arrived on.
Translation and FIWARE Data Models
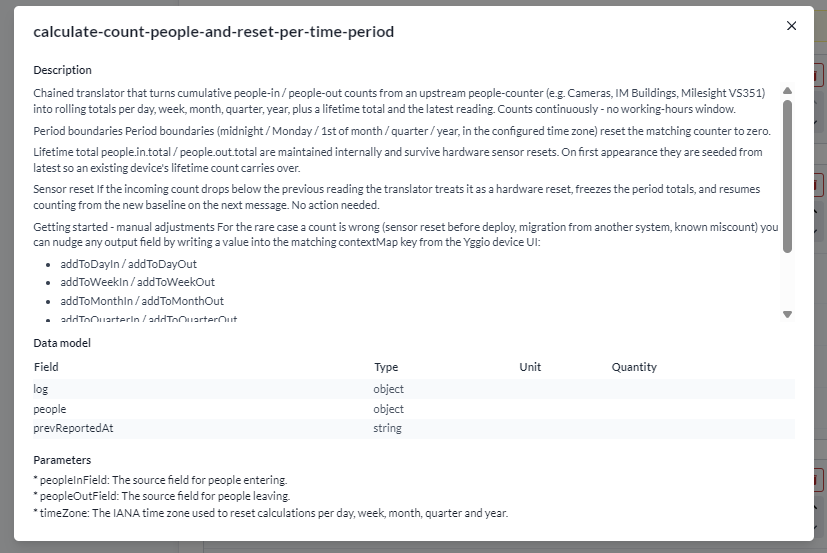
Device data usually arrives as an opaque block of bytes. A translator turns it into a fully formed entity conforming to FIWARE Smart Data Models, using NGSI-LD naming, so the same measurement carries the same field name regardless of vendor.
Details that matter when writing one:
- Translators run in a sandboxed isolate, not in the service process. They have no access to the network, the file system or the host, so an uploaded translator cannot compromise the platform.
- Each translator declares a spec, and the sandbox rejects any emitted field that is not in it. A translator cannot quietly invent a field, which is what keeps the data model from drifting.
- Translators chain, and can write to more than one node, so one device's data can feed several logical entities.
- Updates are atomic, so a partially applied translation is never observable.
See Translator Development and the Translator API.
Publisher and Subscriptions
The Publisher pushes events out through subscriber channels as they happen, so an integrating system is told about a change rather than polling for it. Subscriptions are scoped, which keeps outbound volume proportional to what the receiver actually cares about. See Publisher.
Device Monitoring
Yggio watches the devices themselves, not only their readings. A device that should have reported an hour ago and has not is a fault worth surfacing, so silence is treated as a signal rather than as an absence of one. Connection health is monitored alongside it.
Databases, Time Series and Retention
Yggio holds the current state and metadata for every device and keeps history alongside it. Both numerical and string values are written to the time series database, indexed so a range query over one device or one group stays fast as history accumulates. Retention is set per connector, from a minimum of two days up to indefinite. See Time series data.
Identity and Access
Identity and access management is handled by Keycloak, so accounts can come from a directory you already run rather than being maintained twice. SAML 2.0, LDAP, Active Directory, OAuth 2.0 and OpenID are all supported.
On top of that sits Yggio's own model: access rights per resource with an explicit owner, roles that define what a user may do (admin, editor, the viewer levels, installer, or a custom role), user groups for changing permissions for many users at once, and the Organization Manager for structuring accounts across an operation. Sharing can be broad through organisation policies or narrow, down to a single user.
Integrations and Connectors
An integration teaches Yggio one protocol; a connector is a configured instance of one, holding the credentials, endpoints and subscription topics for a specific external system, and bound to an account and its devices. That separation is why adding a second LoRaWAN network, or moving devices between networks, is configuration rather than development. Each connector also sets a retention policy and the default flow for devices created through it.
LoRaWAN. Actility / Netmore ThingPark, ChirpStack v3 and v4, Netmore, The Things Network, Loriot and Helium (the last two receive-only). Yggio can also act as the LoRaWAN join server itself, so device keys do not have to be held by a third party.
Generic, for NB-IoT, Cat-M, WiFi, BLE and Ethernet devices. MQTT, either on the platform's own broker or an external one, plus HTTP, CoAP and UDP.
Hubs, for Z-Wave, Zigbee, Matter and Thread. A Hubitat hub connects over MQTT and brings everything it speaks to into Yggio as ordinary devices, including Lutron, LAN and cloud devices reached through Hubitat's own and community drivers. The hub handles the radio protocol, and the link is two-way, so a rule in Yggio can switch a Z-Wave relay or set a level on a dimmer and the new state comes straight back.
Building and industrial systems. BACnet IP and Modbus TCP for direct communication with building and industrial equipment, Delta Controls via the EnteliWeb REST API, SIA Connect edge gateways reaching a range of BMS platforms, and Siemens Desigo CC, which Yggio can supply with sensor data through its REST API.
Manufacturer and service specific. BLE gateways from Dusoniot, Celsiview, Elvaco CME, Klimator road weather stations and Open Weather Map for weather and forecast data.
Around the connectors sits an ecosystem of partners, service providers and platform extensions. Additional protocols can be supported on request. See the Connectors overview, or contact info@sensative.com.
Rules, Scheduling and Automation
Rules evaluate conditions against incoming data and trigger actions, from switching a lamp at sunset to sending a message when a leak is detected. Calculations derive new values from existing ones, and devices can be created, updated and exported in bulk, including through CSV, so an estate of thousands is managed as a set rather than one at a time. The Scheduler handles anything time-based, and Flow executes the resulting task trees, so one trigger can fan out into several ordered actions.
Where the logic is involved, the recommended pattern is to compute it in a translator and leave the rule itself a simple true or false test. That keeps the evaluation next to the data and the rule readable. See the Rule Engine guide.
Analytics and AI
Anomaly monitoring is done first with the alarm translators, which raise an alarm when a decoded field crosses a threshold. Where the normal pattern cannot be expressed as a threshold, the AI model deployment platform trains a model on a sensor's own history and screens each new reading against it. Either way the result is an ordinary value, so it can trigger the same actions any other value can. The AI connector connects an LLM assistant to the platform. Its interaction with Yggio is through the documentation: it answers questions about how the platform works and how to use it, drawing on the documentation and on the internet. Querying device data and running automations through the API are planned for a future release.
Reporting and Business Intelligence
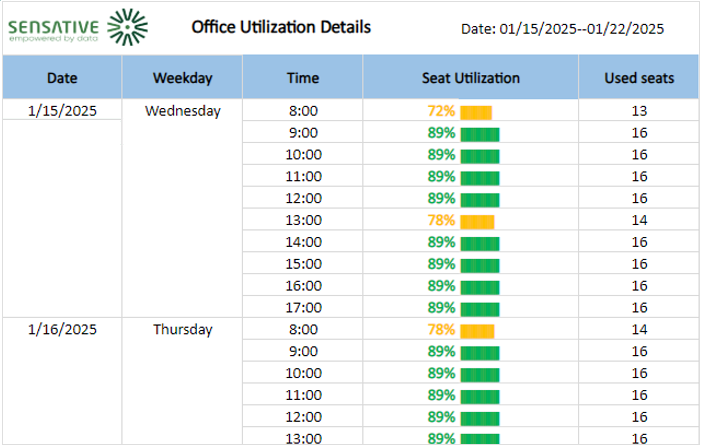
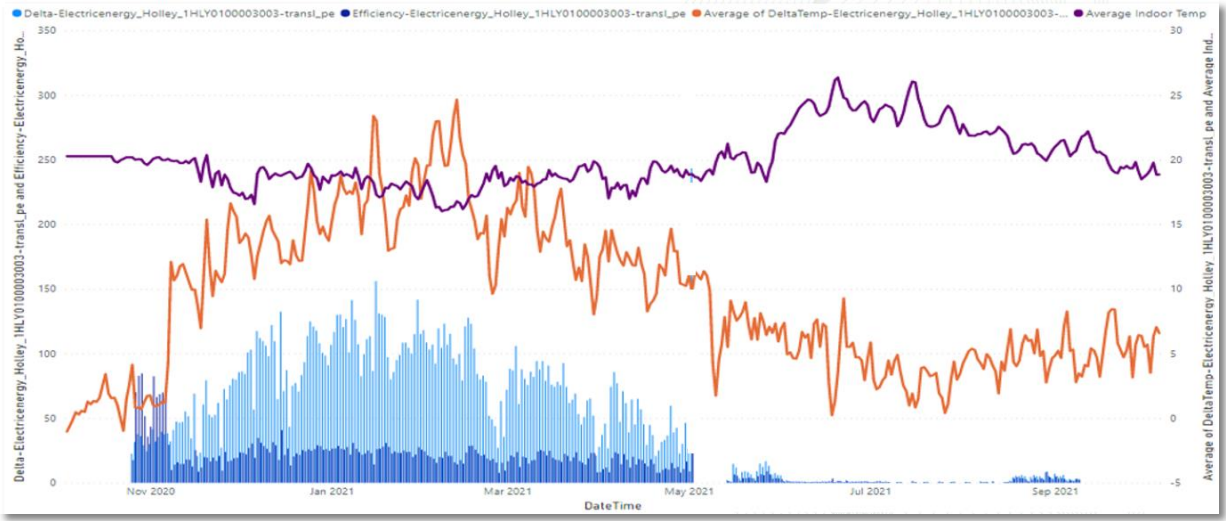
Reports cover recurring needs such as metering, utilization and invoicing data, scheduled by the Rule Engine and delivered by email. Results can be read in Yggio, exported, or consumed where the organisation already works, through Power BI or Grafana. See Reports.
APIs and Extension Points
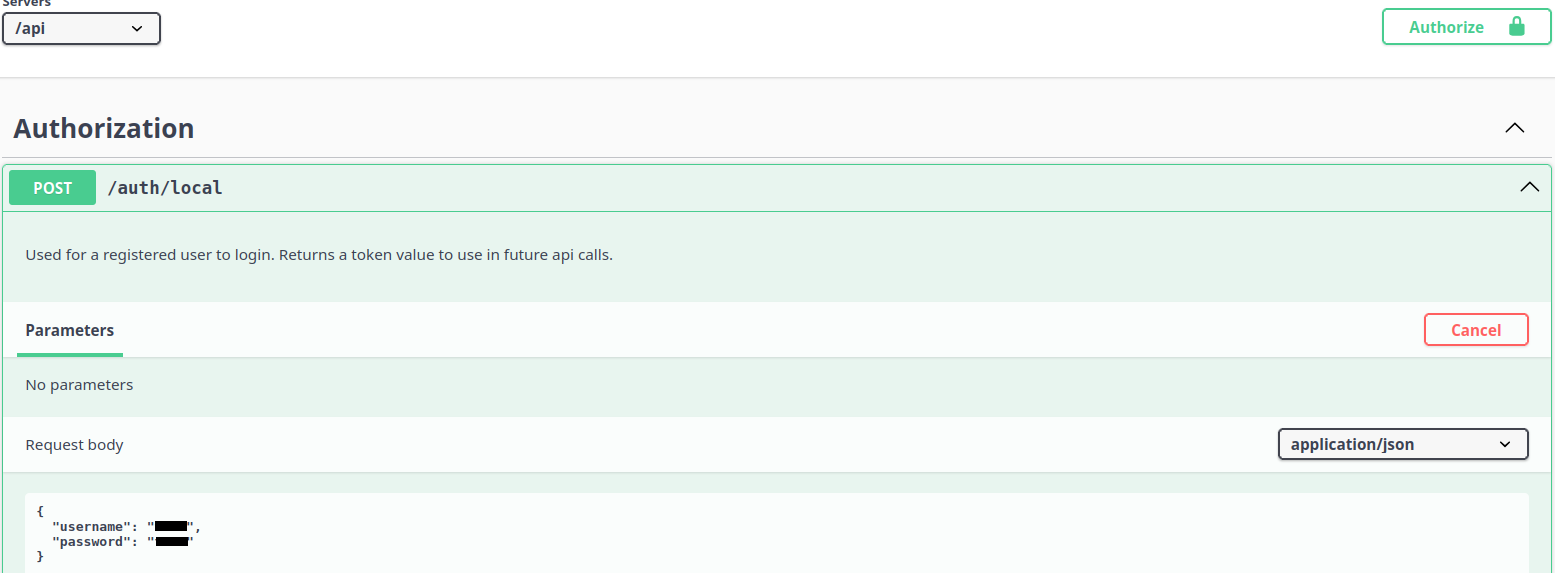
- Yggio REST API, the main programmatic interface, covering everything outside the NGSI scope such as user management and rules, with interactive Swagger documentation.
- FIWARE NGSI, served alongside it, so entities can be read and written using FIWARE conventions.
- Commands and downlinks, for sending instructions back to devices, including LoRaWAN downlinks and Z-Wave inclusion.
- Geofences, with an API of their own.
- MQTT for publish and subscribe integration.
- Node.js SDK and Node-RED for building on the platform without starting from raw HTTP.
- Building an integration, when a protocol or system is not yet supported.
Data Marketplace
The Data Marketplace is where datasets are discovered and shared, whether that means finding data to build on or contributing your own for others to use.
Where to Go Next
- User Guide for working with the platform day to day.
- Developer documentation for building against it.
- Training material, the fastest way to see the platform end to end. It runs in three levels:
- Standard workflow: adding LoRaWAN devices, views, alarm views and translators, CSV export and import, map views, dashboards, data sharing.
- Extended workflow: the rule engine, calculations, generic nodes, simple and Excel reports, organizations, roles, connectors, external data sharing and flows.
- Advanced usage: Grafana, Power BI, Node-RED, MQTT Explorer, Postman, curl and translator development.
- Release notes for what changed and when.
- Sensative hardware: the LoRaWAN and Z-Wave sensor documentation.
- Legal agreements and policies.