Device views
The device view allows you to create a customized display in the Devices section and switch between multiple views with just a click. This provides clear and easy access to values like temperature and desk occupancy.
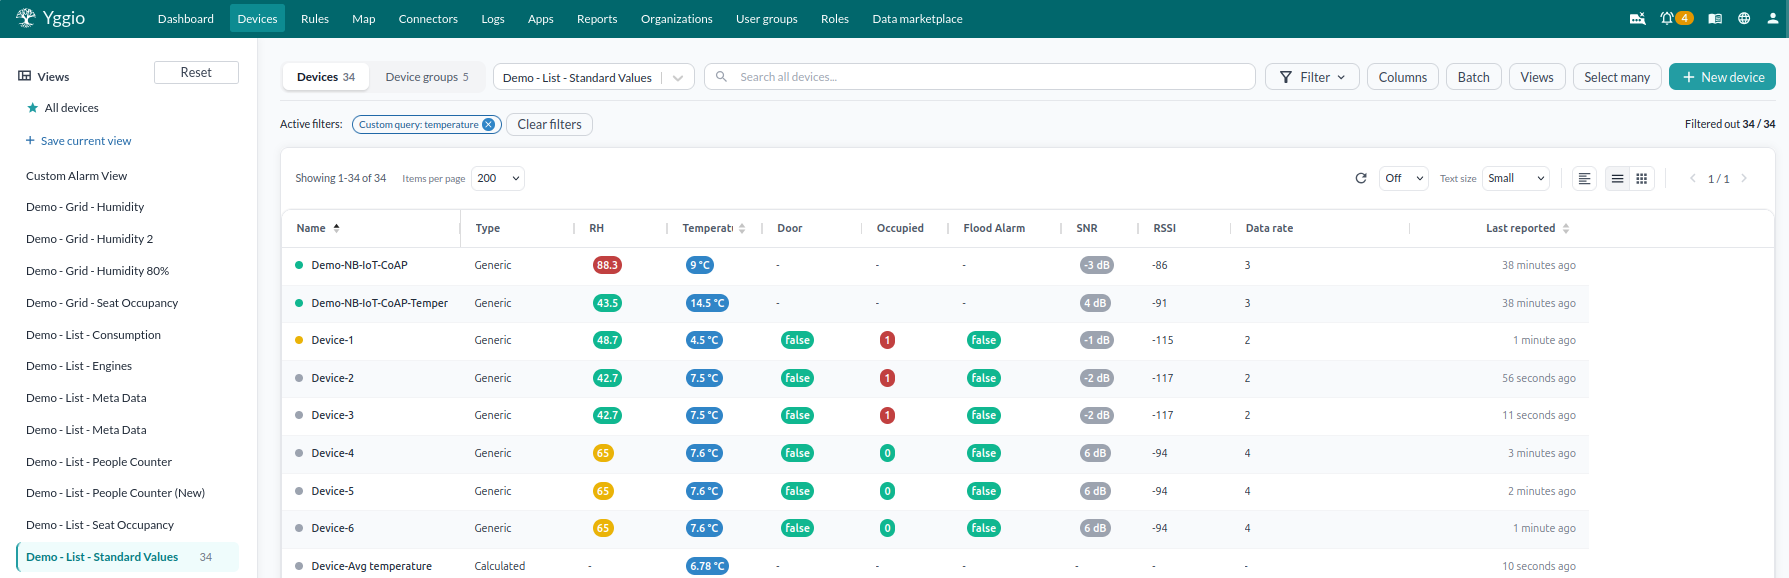
The purpose of a view is to have the data you are interested in predefined and one click away, already filtered and already laid out. What you see is what you get: a view saves the state of the list as you left it, not just the columns.
Everything you set on the list is stored in the view:
- The filters, so only the devices you care about are listed
- The columns, which values they show, and their widths
- The colour coding on those columns
- The sorting
- The refresh rate, which re-runs the filters and the sorting - see A view that brings deviations to the top
- The text size, the items per page and the table or grid layout
- Whether the Views panel itself is open or closed
So a view is worth building for each job you come back to: a commissioning view, a daily monitoring view, one per customer or building. Saved views are listed down the left, and switching between them takes one click.
A view is not stuck in your account. It can be exported as a JSON file for another user to import, or shared with a whole organisation through the organisation manager. See Export views.
Columns
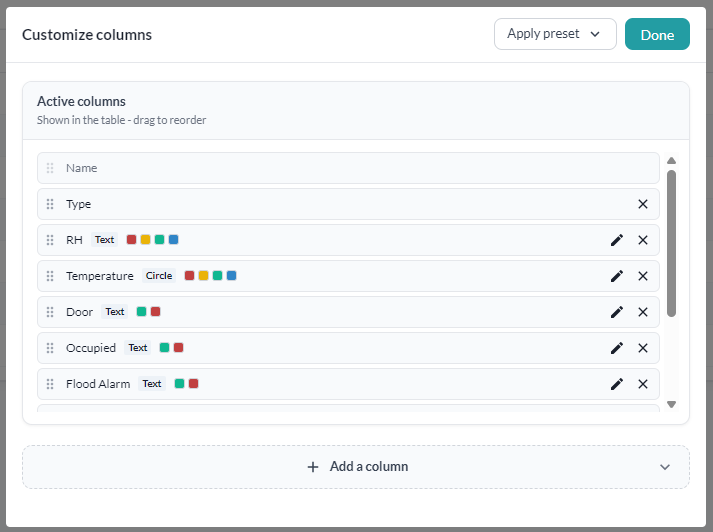
Press "Columns" above the list to open Customize columns. There are two ways to get the columns you want:
- Apply preset - pick a ready-made set of columns from the dropdown and it is applied in one go. See Column presets.
- Build your own - add the columns you want and arrange them yourself, for a table that matches how you work rather than a general-purpose one.
Under "Active columns" are the columns currently in the table. Drag them by the handle to reorder, press the pencil to edit a custom column, or the cross to remove one. Name stays, as the column that identifies the device.
Column presets
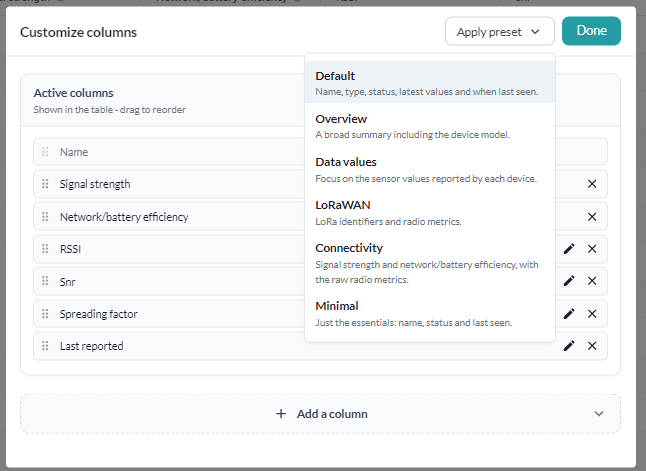
A preset is a ready-made set of columns. Press "Apply preset" in Customize columns and pick one, and the table is rebuilt around it. It is the quickest way to a useful table, and the starting point for one of your own.
| Preset | Columns |
|---|---|
| Default | Name, type, status, latest values and when last seen |
| Overview | The same, plus the device model |
| Data values | Name, the reported sensor values, and when last seen |
| LoRaWAN | Name, DevEUI, RSSI, SNR, spreading factor, frame count, last seen |
| Connectivity | Name, signal strength, network/battery efficiency, RSSI, SNR, spreading factor, last seen |
| Minimal | Name, status and last seen |
A preset replaces the active columns rather than adding to them, so apply one first and then add or remove columns from there.
Connectivity is the network quality preset. It puts the two rated meters - signal strength and network/battery efficiency - next to the raw RSSI, SNR and spreading factor they come from. That is the table where a device with a strong signal but an expensive link is visible at a glance.
Presets are columns only. Sorting, filters and colour thresholds are not part of them, so apply the preset, add what else you need, then save the result as a view to keep it.
Add a column
Press "Add a column" and there are two kinds to choose from.
- Example fields from your devices are offered as chips at the top. They are read from the devices you actually have, so clicking one adds it as a plain column immediately. Quickest when you just need a field visible.
- Custom columns are ones you define, with a name and optional colouring. They are reusable: define a column once and add it to any table.
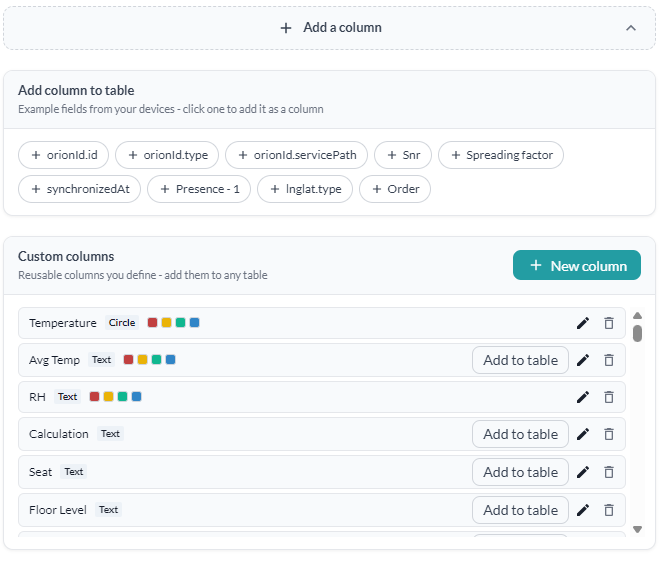
For each custom column the list shows its display type and any threshold colours, with buttons to add it to the current table, edit it, or delete it.
Create a custom column
Press "New column" under Custom columns.
-
Field - the field to show, written exactly as the device reports it, for example
temperatureornetwork.rssi. Find the spelling in the Data section of a device. The Help link under the box explains dotted paths for nested values. -
Display Name - what appears in the column header.
-
Optionally press "Add visual settings" and set how the value looks:
Setting Choices Value type Number, Boolean, String or Timestamp Display type Text, Bar, Circle or Icon Color Mode Background, or Text color -
Optionally add Thresholds, which are colour rules based on the value: a temperature above 25 in red, below 18 in blue. Press "+" to add each rule. The Preview shows what the column will look like as you change the settings.
-
Press "Create".
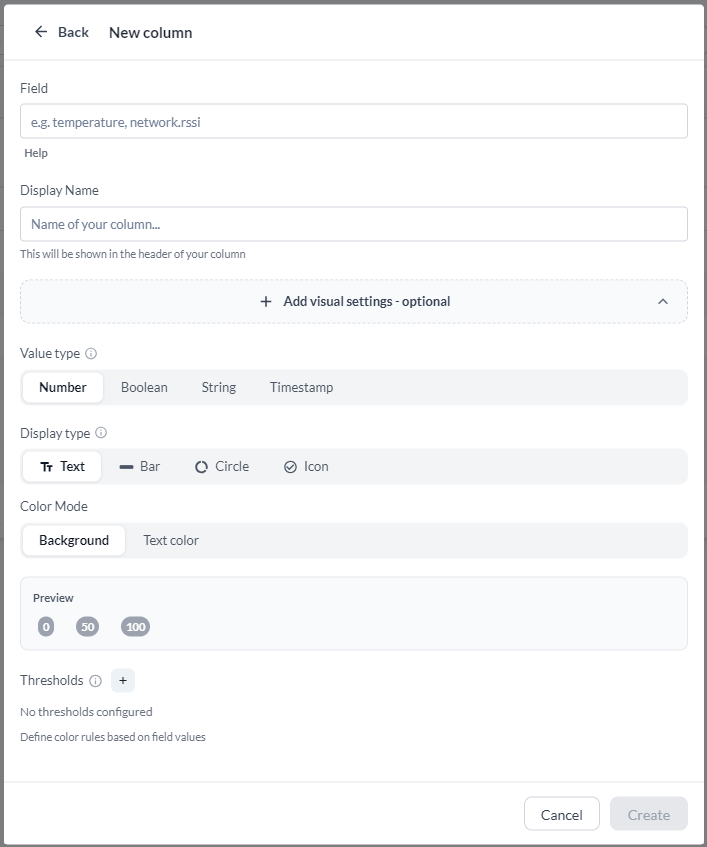
The value type decides which display types and thresholds are available. A Bar or a threshold range needs a number; a Boolean is better as Text or an Icon.
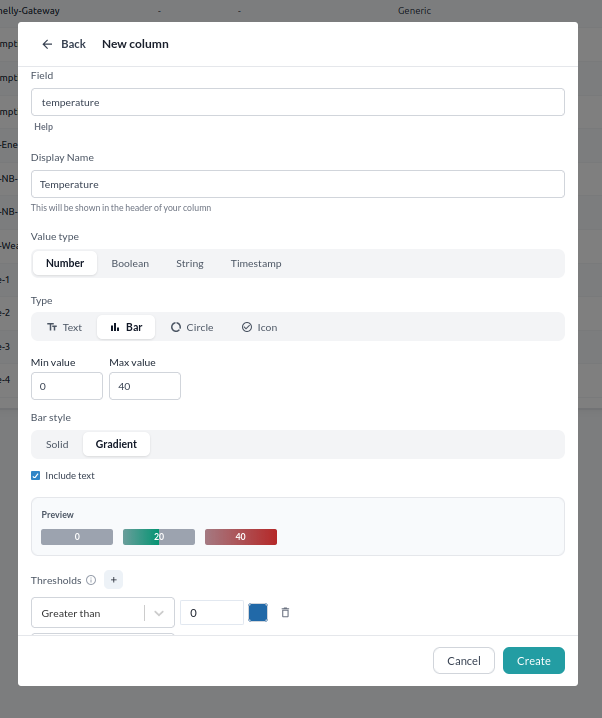
The display type can bring settings of its own. Bar asks for a Min value and a Max value to scale between, a Bar style of Solid or Gradient, and whether Include text prints the number on the bar.
Below, temperature has been made into a gradient bar scaled 0 to 40, with a threshold colouring it
once it goes above a value. The Preview shows the result before you commit to it.
Once created, the column is in the Custom columns list for good. Press "Add to table" to put it in this table, and the same column can be added to any other table later.
Press "Done" when the table looks right, then save it as a view so the layout is not lost.
Save the list as a view
Get the list looking the way you want it first - filters, columns, sorting, text size and the rest - because all of it is saved.
- Set the filters you want. To list only devices that report the field you added, press "Filter", find "Custom Query" and enter that field. Several conditions can be combined to narrow it further - see the link under the text box, and Custom query.
- Press "Views", then "Save current view".
- Enter a name for the view and press "Save".
The view now appears in the Views panel. Active filters are shown as tags above the list, so it is clear why the list is as short as it is.
A view that brings deviations to the top
The refresh interval is saved with the view, and a refresh re-runs the filters and the sorting. So a view can be built to surface problems by itself:
- Filter on the condition that matters, for example a temperature above 25.
- Sort by that value, highest first.
- Set a refresh interval.
- Save it as a view.
Each refresh re-evaluates which devices meet the condition and re-applies the sort. Devices that have deviated move to the top without anyone touching the page.
Export views
A view can leave your account, which makes it worth getting one right and then handing it out rather than having each person rebuild it.
-
Click the "Views" button and then click "Export."
-
Select the view you want to export and whether you want to export as a string or to an organization.
- As a string - the view comes out as JSON, which another user imports into their own account. The efficient way to share a view with individual users, including across accounts.
- To an organization - the view is shared with the organisation through the organisation manager, so everyone in it has the view. This needs device admin access rights.