Device details
Press a device in the device list and it opens on its own page, with the sections down the left and "Back to device list" above them. This is everything the platform holds about that one device: what it is, what it has reported, what is configured on it, and who can see it.
The device's name, type, last report time and status stay visible above the menu in every section. The menu also shows a count next to Translators, Channels and Contextual parameters.
Use it to check a device's details, look at what it has reported, or confirm it is working. To diagnose a problem, the usual path is Data for what arrived, then Logs for what happened, then Translators for why it was decoded that way.
| Section | What it holds |
|---|---|
| General info | Name, description, photos - and where you delete the device |
| Specifications | The device's technical information |
| Data | Everything the device has reported, readable or raw |
| Charts | This device's time series, plotted |
| Logs | Events on the device, and which of them are alarms |
| Translators | The translators decoding it, and their versions |
| Position | Its longitude and latitude |
| Access rights | Which other users can see it |
| Channels | Publishing its data out of the platform |
| Contextual parameters | Your own metadata on it |
| Commands | Buttons and downlinks triggered from this device |
| LoRaWAN control | Sending a raw LoRaWAN downlink, and the downlink queue. LoRaWAN devices only |
| Calculations | The calculation behind it, if it is a calculated device |
| Report interval | How often it is expected to report |
| Tools | Synchronising it, and importing LoRa devices |
The sections appear in this order in the panel. Some are only there when they apply - LoRaWAN control for LoRaWAN devices, Calculations for calculated ones.
General info
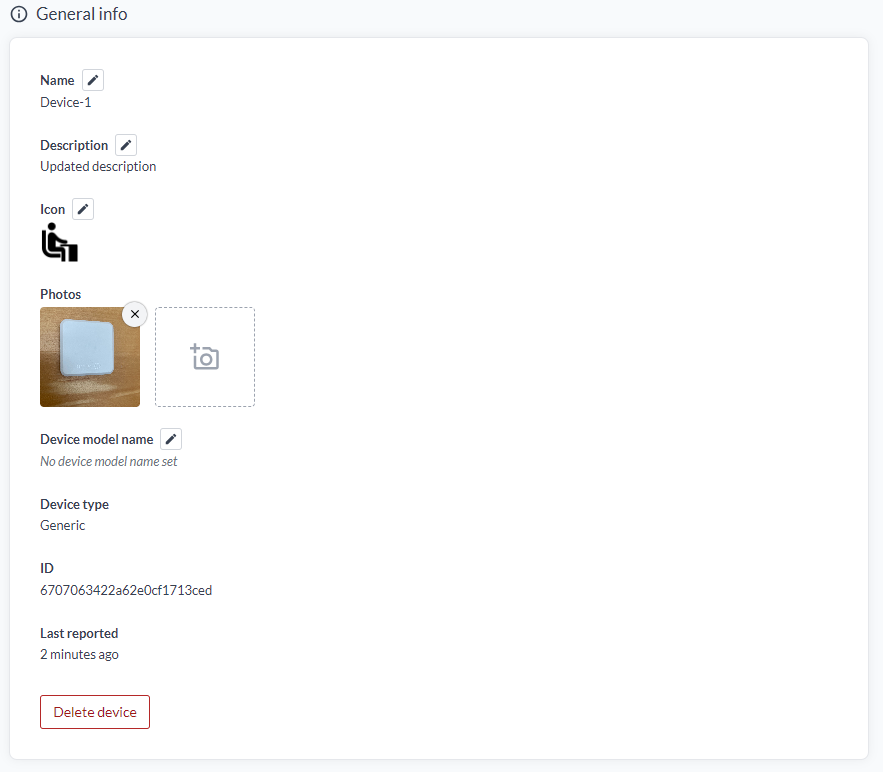
What the device is, and the fields you are most likely to edit. The ones with a pencil beside them can be changed here; the rest are set elsewhere or by the platform.
- Name - what you see in the device list. Editable
- Description - free text. Editable
- Icon - the icon shown in the device list, on the map and beside the name. Pick one of the presets, or upload your own PNG, JPEG or GIF of up to 8 MB; uploads are scaled down to 256 px. Choosing one replaces the other. Editable
- Photos - pictures of the installed device, added and removed here. Often the fastest way for a later visitor to identify which box on the wall this is
- Device model name - the model designation, which also drives translator suggestions. Editable, and shown as "No device model name set" when empty
- Device type - Generic, LoRaWAN and so on. Set at installation and not editable
- ID - the device's identity inside Yggio. See The device ID
- Last reported - when data last arrived
At the bottom is Delete device.
Remove the device
- Find the device in the device list and click it.
- In the General tab, click delete.
- For a LoRaWAN device, decide whether to clear "Delete external". It is ticked by default.
- Confirm the deletion.
Leaving "Delete external" ticked decommissions the device on the LoRaWAN server as well. Clearing it removes the device from Yggio only, leaving its registration on the network server intact.
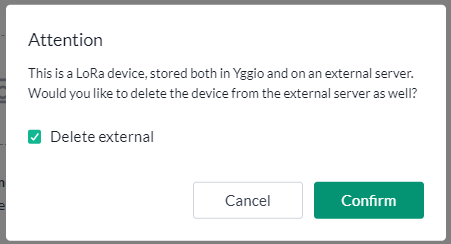
Clear it when the device is moving to another Yggio account, or being re-provisioned elsewhere, and the registration should survive.
To remove several devices at once, use Select many instead.
The device ID
The ID is how Yggio identifies this device internally. Every device has one, no two devices share one, and it never changes - not when the device is renamed, not when it is moved to another connector.
The device identifiers are unique too. A DevEUI, a secret, an IMEI or a serial number identifies exactly one device, and that is how incoming data is matched to it. But each belongs to a particular kind of device, and a device carries only the one its type uses. The ID is the identifier every device has, whatever its type, so it is the one the API and Batch update use.
You need it in three places:
- The API. Every call that acts on a device is addressed by its ID, so this is the value you copy into a request. See API access.
- Batch update. Rows are matched to devices by ID, so the export has to
include the
_idcolumn. - Support. Quoting the ID identifies the device exactly. Names are not unique, so two devices called "Room 2 sensor" are told apart by ID.
Copy it from here rather than retyping it - it is a long hexadecimal string and a single wrong character simply fails to match anything.
Specifications
Read-only technical information, grouped by where it comes from. Only the groups that apply to a device appear, and only the fields that have a value. A generic device shows very little; a LoRaWAN one shows a lot.
- General - the connector carrying this device, by name, plus the device model name, and the LoRa version and device profile where they apply
- LoRa - the LoRaWAN identifiers and credentials: the DevEUI, the AppKey, and the other keys for the activation type in use
- ChirpStack - application, network server and organization IDs, and the device profile
- Netmore, Nibe, Elvaco - the identifiers each of those integrations uses, such as service provider, system ID or device identification
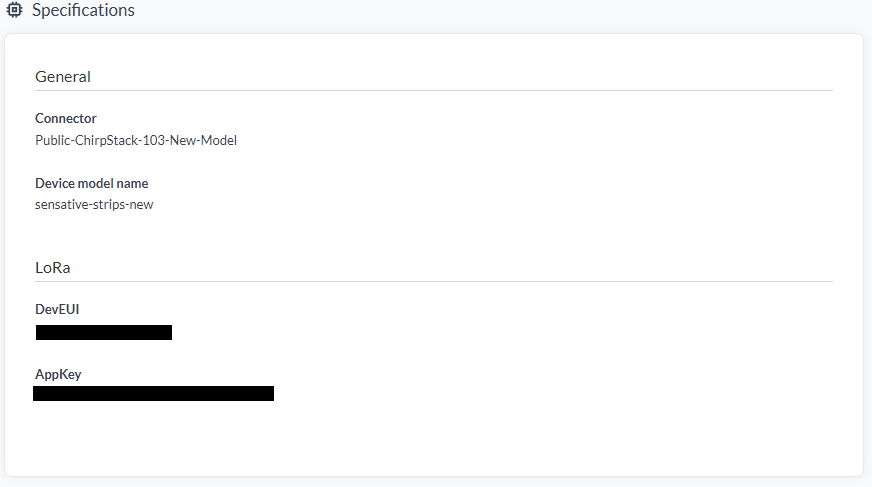
This is the page to open when you need to confirm what a device was actually provisioned with, rather than what you meant to provision it with - which connector it is really on, which model name it really carries, whether the DevEUI matches the label on the hardware.
The keys in the LoRa group are credentials - the AppKey encrypts the device's traffic. Remember they are on screen before sharing a screenshot of this section.
Data
Everything the device currently holds: the values its translator decoded, the connectivity information from the network, and any custom fields added at install or update.
Two controls at the top:
- Filter - Values for the decoded readings, Connectivity for the network side, or All for both
- Display - Pretty for a readable list, or Raw for the underlying structure, which can be copied as code
An entry with a chevron is an object and expands, so a location shows its parts rather than one
long value.
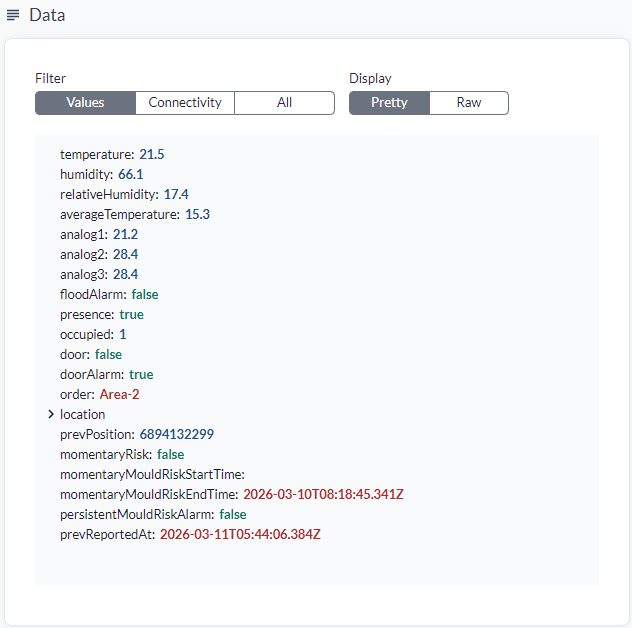
The colours are the data types
| Colour | Type |
|---|---|
| Blue | Number |
| Green | Boolean |
| Red | String |
A field's type decides how it can be compared. That in turn decides what you can do with it in the rule engine, in a calculation, and in a threshold on a custom column.
The types are not always the ones you would guess from the value. Above, occupied: 1 is blue - a
number, not a boolean, though it reads like a flag - while door: false is green and genuinely
boolean. Timestamps such as prevReportedAt are red: they are strings, so they compare as text
unless something parses them first.
The field names matter too
The name shown here is the exact name the field has everywhere else in the platform. It is what you pick in a chart and what you put in a column. It is also what you reference in a report, a rule, a calculation or a channel, and what comes back from the API.
So this section is the per-device reference for the data model: read what
a translator did produce, rather than working out what it should have. Copy names from here instead
of retyping them - relativeHumidity and humidity are different fields, and both exist on the
device above.
To check a device is behaving, it answers three questions. Is the field there at all? Is its value plausible? And, under Connectivity, does the network side still look healthy?
Charts
This device's own time series, plotted. Charts only work on devices with timeseries data fields, for example a temperature measured over time.
Pick a field and the chart appears, with the same settings as everywhere else - time period, resolution, calculation, curve type and y-axis range. "Go to advanced view" opens the full tool, where several devices and fields can be compared in one chart.
See Charts for what each setting does and for the calculation types.
Logs
The history of this one device: what happened to it, when, and who or what did it. Where Data shows the current state, Logs show how it got there.
Events recorded here include:
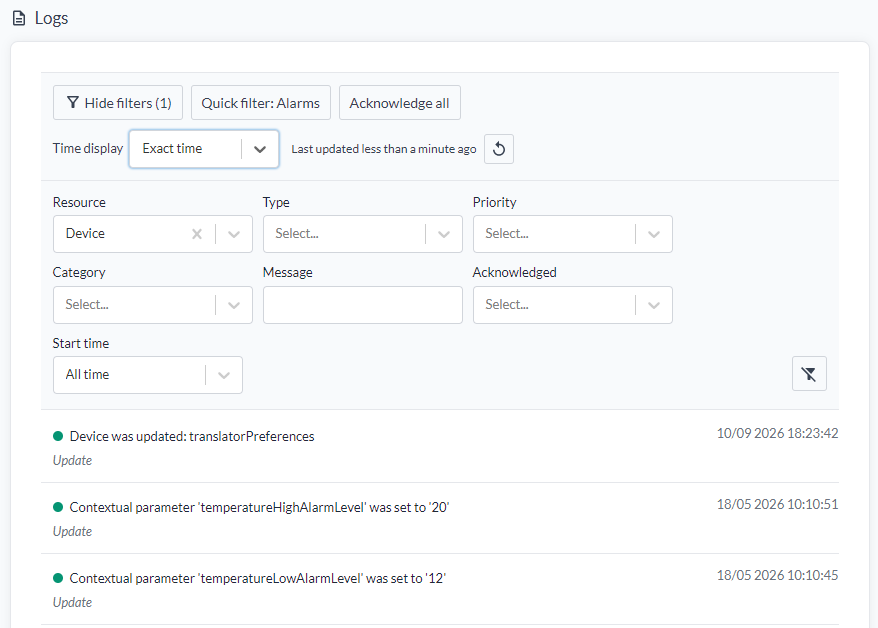
- Configuration changes - translators added or changed, contextual parameters set, the name or description edited. Each entry names the field and the new value, so "who set this to 20" has an answer
- Alarms, of every kind the device or its alarm translators raise
- Access rights changes, so a device becoming visible to someone else is on the record
- Downlinks sent to the device
Priorities, alarms and acknowledging
Entries carry a priority of low, medium, high or severe. An unacknowledged log of high or severe priority is an alarm, and the count of those is what the bell icon in the top right corner shows.
Acknowledging an entry is how you record that it has been dealt with - it stays in the log but stops counting as an alarm. "Acknowledge all" clears the lot for this device at once.
Finding a particular event
The log for a device that has been in service a while is long, so it is searchable rather than just scrollable. Open the filter panel and narrow by:
| Filter | Narrows to |
|---|---|
| Resource | The kind of thing the entry is about, for example Device |
| Type | The type of event |
| Priority | Low, medium, high or severe |
| Category | The category shown under each entry, such as Update |
| Message | Free-text match on the entry text |
| Acknowledged | Acknowledged or not |
| Start time | Only entries since a point in time, or All time |
"Quick filter: Alarms" jumps straight to the alarms, and the filter button beside the panel clears everything back. Time display switches between exact timestamps and relative ones ("2 hours ago"), which is the difference between reading a log and correlating it with something else.
For logs across all devices rather than this one, see Logs.
Translators
Which translators are decoding this device, and how they are configured. A translator turns the device's raw payload into named values; without one, data arrives but is not interpreted.
Each translator appears as a card with its name, who publishes it, the version in use and its upgrade policy. Where a translator takes parameters, their current values are shown underneath with the type and description of each.
The cards are stacked in chain order, with an arrow between them. The first decodes the payload, and each one after it takes the previous one's output as input. The order is part of the configuration, not a display choice: a chained translator reading a field the one above it has not produced yet will not work.
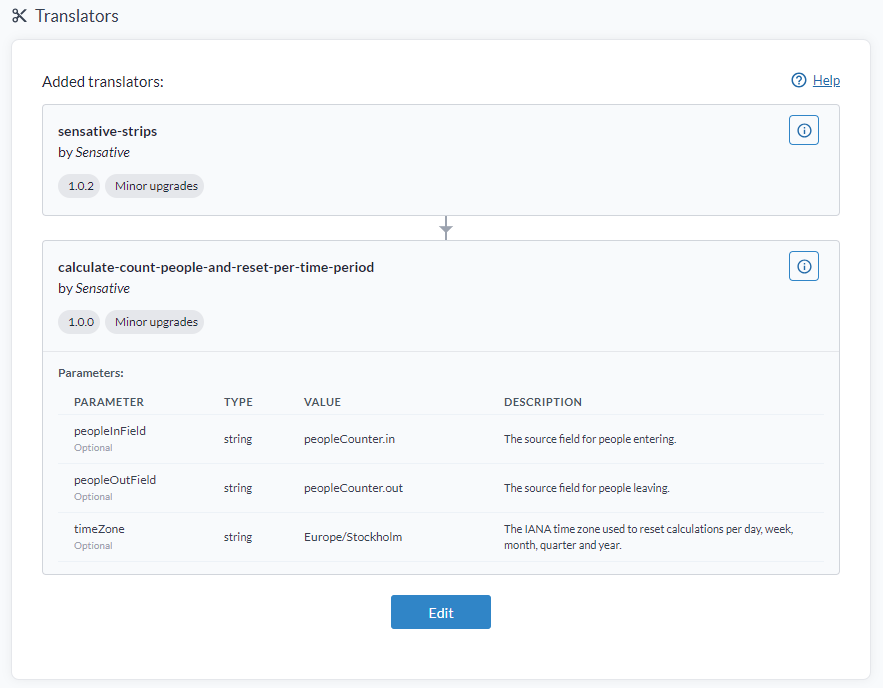
Edit changes the translators on this device. To change them across many devices at once, use Edit Translators in Select many.
The info button
The (i) on each card opens that translator's own reference, which is the definitive answer to what this device should be producing:
- Description - what it decodes, or for a logic translator what it calculates, including its behaviour in awkward cases such as a counter resetting
- Data model - every field it outputs, with the type, unit and quantity of each
- Parameters - what each parameter does
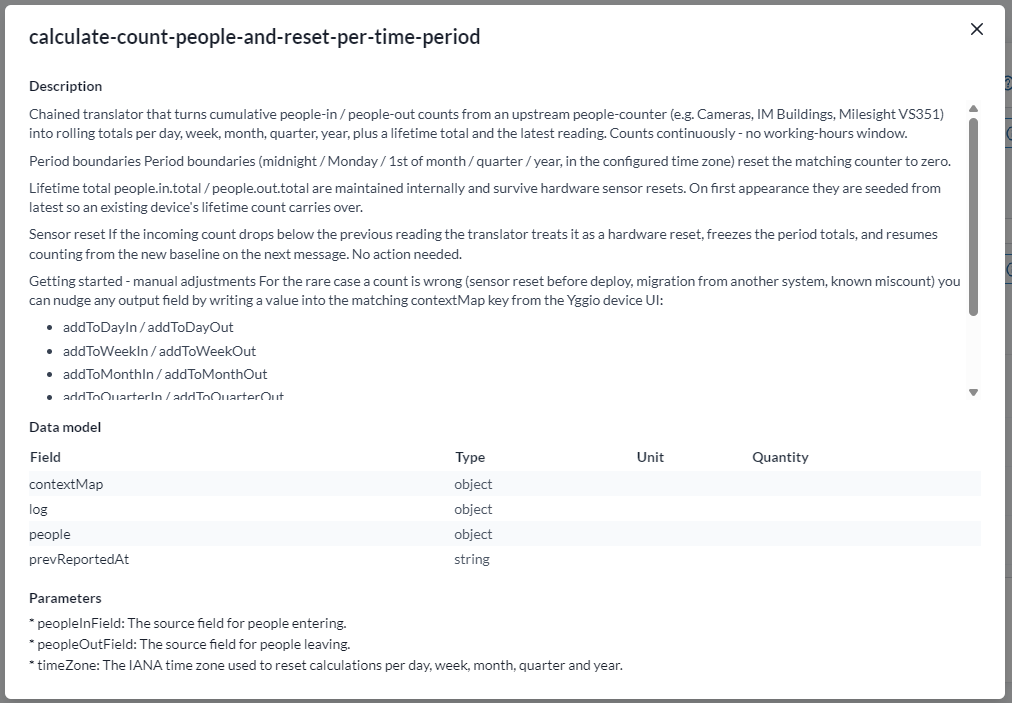
Read it alongside Data. The data model here is what the translator claims to produce; Data is what the device is actually holding. A field in one and not the other points at a translator that is not doing what you expected.
It is also where to get field names, types and units before building a chart, a rule or a report on this device.
Changing a major version
A translator's major version changes when its data model changes, so Yggio shows the current and new data models side by side and asks you to confirm before applying it. See Changing a major version.
Position
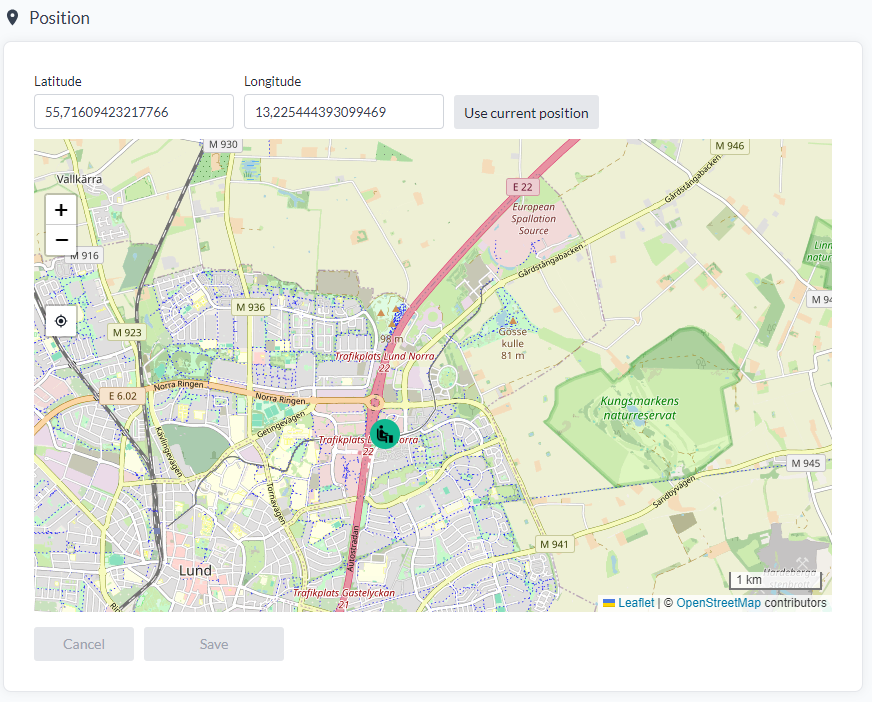
Where the device physically is, as a longitude and latitude. Position is what puts the device on the map and in a map widget, including on a floor plan used as a geo-referenced overlay there. It is worth setting even for devices that never move.
It does not affect the Floor Plan widget, where markers are placed on the image by hand and their placement is independent of any coordinates.
Set it in one of three ways, then press Save:
- Type the coordinates into the latitude and longitude boxes, if you have them from a survey or a drawing.
- Place it on the map below the boxes. Zoom in and put the marker on the right building or room. Easier when you know where the device is but not its coordinates.
- Use current position takes the coordinates from the browser you are sitting at - the quick option when standing next to the device during installation.
A device that reports its own location does not need any of this. A GPS-enabled device sends its position with its data and moves on the map by itself. Setting a position by hand on such a device has no effect on where it appears.
Devices can also be repositioned from the large map, which is usually the faster way when you are placing several devices in the same area and want to see them relative to each other.
Access rights
Who besides you can see this device, and what they are allowed to do with it. The owner is shown at the top; everyone else appears in the access table below.
Access can be given three ways, on the tabs above the table:
| Tab | Share with |
|---|---|
| Organization | An organisational unit, so everyone in it inherits the access |
| User | One named user, by username |
| User group | A named group of users |
Organisation and user group scale better than naming individuals: a person joining or leaving is handled where the organisation or group is managed, rather than device by device.
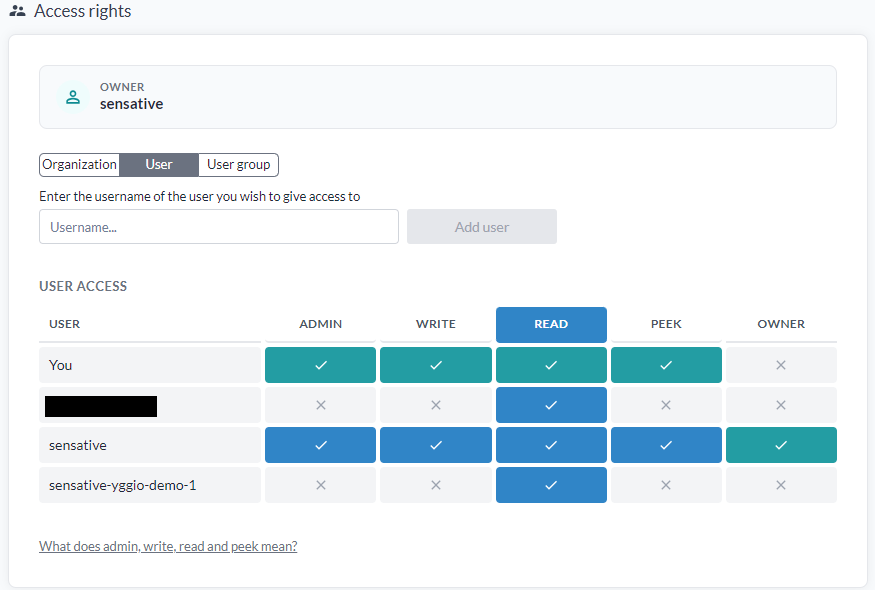
The table is a grid of who against which level - admin, write, read and peek, with the owner marked in its own column. Each row shows exactly what that user or group currently holds, including your own row, so you can see your rights on a device someone else shared with you.
For what each level actually permits, see access rights. The same explanation is behind the "What does admin, write, read and peek mean?" link under the table.
Sharing into an organisation tree
The Organization tab is the finest-grained of the three.
- Choose the Organization tab and pick the organisation.
- Find the subunit in the tree below it. The tree is searchable, which matters once an organisation has more than a handful of units.
- Select the node to share to. Any level can be the target: the whole company, one city, one building, or a single floor.
- Check the path shown under the tree - "Company 1 / City 1 / Building 2" - then press Share.
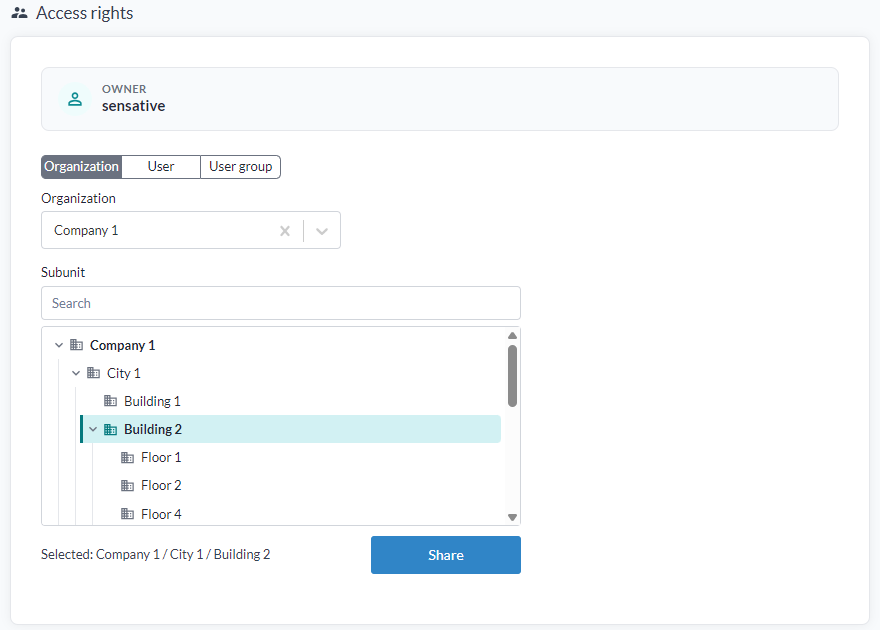
Access reaches upwards. Everyone with access to the branch you share to gets the device, and so does everyone with access above it: share to Building 2 and the people at Building 2 see it, as do those with access at City 1 and at Company 1. Nobody on Building 1, and nobody further down, does.
This works the opposite way round from how it may look. Sharing high up the tree does not widen the audience; it narrows it to the few people who hold access at that level. Sharing at the floor the device sits on reaches everyone from that floor upwards, usually the larger group.
There is no "share with the whole company" here. The audience is always whoever has access at or above the branch you picked. Reaching everyone would need a branch that every user has read access to.
Per device, this shares an estate along its real structure: the sensors on one floor go to that floor's unit, and only people at or above that unit see them. The tree itself is managed in the organisation manager.
Sharing into a tree needs two rights at once: admin on the device, and organisation admin on the organisation. Either alone is not enough. That is the usual reason this tab will not let someone share a device they can otherwise see.
To share many devices at once, use Access Rights in Select many, which is also the only place the owner of a device can be changed.
Channels
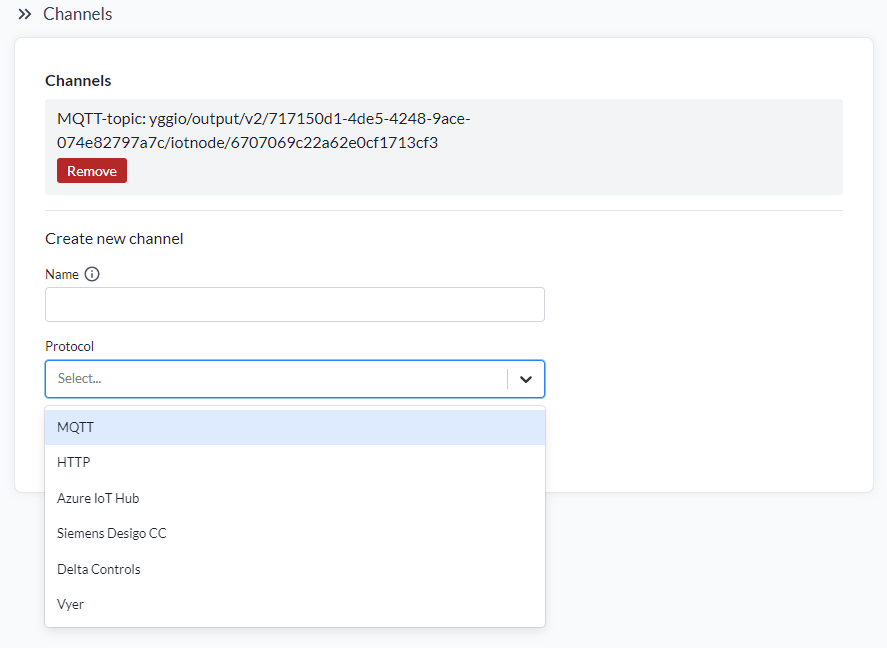
A channel publishes this device's data out of the platform. Existing channels are listed with the target they publish to, each with a Remove button, and new ones are created below.
To create one, give it a name and pick a protocol. The choices fall into two kinds:
- Generic - MQTT publishes onto Yggio's own broker, and HTTP posts the data to a URL you provide, which is the webhook case. Both are for feeding a system of your own
- Named integrations - Azure IoT Hub, Siemens Desigo CC, Delta Controls and Vyer, which write into that specific system rather than to a generic endpoint
Some of the named integrations need field mapping as well. The receiving system has its own field names, and the channel needs to know which of this device's fields correspond to them. Where that applies, the channel asks for the mapping when you create it. Get the field names from Data.
An MQTT channel's topic is shown once the channel exists. It includes the device ID, so the topic never changes even if the device is renamed.
To create the same channel across many devices at once, use Channels in Select many.
Contextual parameters
Metadata of your own, attached to the device. This is where everything the device cannot tell you about itself goes: which building it is in, which floor, its street address, what it belongs to, whether it is in production. Yggio stores and indexes it but does not interpret it.
Each parameter is a name, a value and a type, listed with an edit and a delete button, and "+ Add" at the bottom for new ones. The type is shown beside each value.
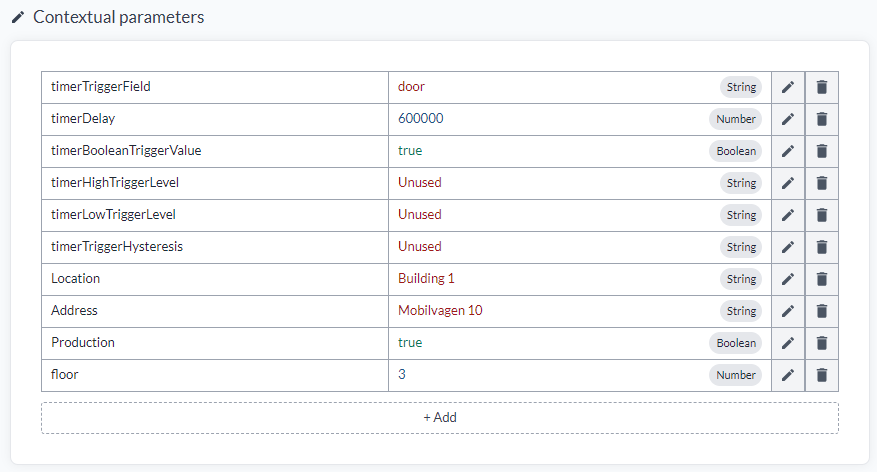
Five types are supported: number, string, boolean, object and array. Numbers, strings and booleans
are typed as you would expect; for the other two, write the value the way you would in JSON - an
array as [list of data separated by commas], an object as {data in object}.
Names are taken exactly as you type them, so keep them consistent across devices. In the example
above Location and Address are capitalised while floor is not - which is allowed, but it means
a filter or query has to know which spelling a given device used.
They are indexed, so they are what you filter and search the device list on, group views by, and pull into reports. Fill them in at installation. See Contextual parameters for setting them from a CSV file, and Editing fields in bulk for changing them across many devices afterwards.
Not for translator settings
Contextual parameters used to double as the place a translator's settings were kept - the
timer... entries in the example above are that older pattern. Translators now declare their own
parameters, with names, types and descriptions, and those are set on the translator itself in
Translators.
Devices configured the old way still work, and some translators still read a contextMap entry as a fallback when the matching parameter is not set. For anything new, put translator settings on the translator and keep this section for metadata.
Commands
Actions triggered from this device. Some are aimed at the device, but they do not have to be - a command can just as well send an email or write to another system. Two tabs, for two different approaches:
- Publish MQTT message sends a downlink to the device directly. It needs a generic MQTT connector
- Command buttons creates a button that triggers a rule, and the rule decides what happens - which is often something sent to the device, but need not be
Command buttons
- Pick the button text from the list.
- Press Create.
- Build the rule that the button triggers, in the rule engine.
The button then appears on the device, and can be added to the device list as a column, so it can be pressed from the list without opening each device.
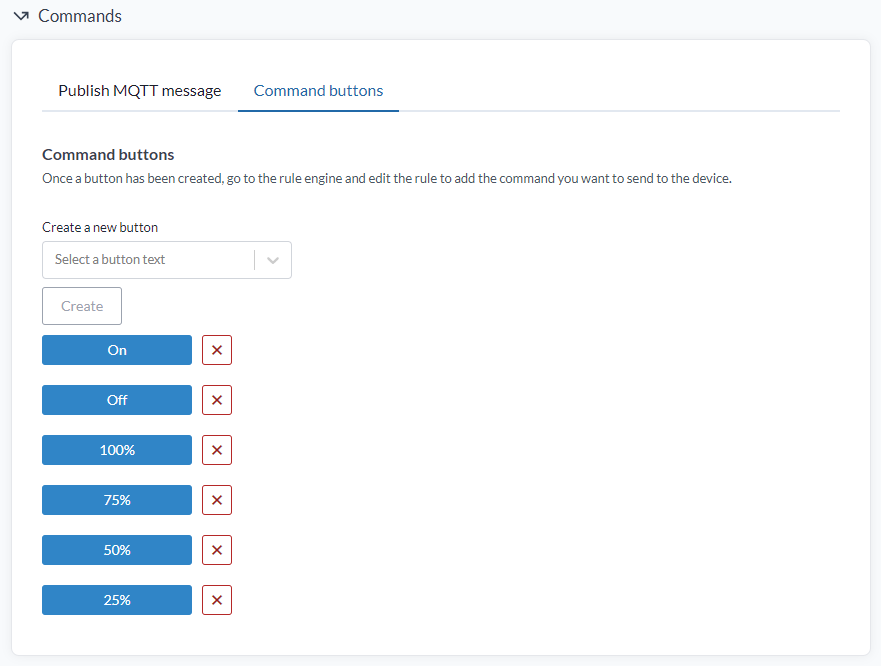
A button does nothing on its own. It is a trigger: pressing it starts a rule in the rule engine, and the rule decides what actually happens. So creating the button is half the job - the other half is building the rule that listens for it.
Because the action is a rule, it can be anything the rule engine can do:
- Send a LoRaWAN downlink to the device
- Publish an MQTT message
- Send an email or an SMS
- Anything else a rule can be built to do, including several of them at once
So a button labelled "Off" does not inherently turn anything off; it runs whatever rule you connect to it. The buttons above - On, Off and a set of percentages - are a dimmable light, where each button runs a rule sending the matching downlink.
Buttons are removed with the delete button beside them, which does not remove the rule - that is handled in the rule engine.
LoRaWAN control
Sending a raw downlink to a LoRaWAN device, and seeing what is queued. This section only appears for LoRaWAN devices, and is labelled "Lora control" in the menu.
Where Commands wraps a downlink in a button and a rule, this is the direct route: you supply the bytes yourself.
| Field | What it takes |
|---|---|
| Data | The payload to send, as hex. Required |
| FPort | The port to send it on, between 1 and 223. Required |
| Reference | An optional reference of your own, used to identify this downlink in the acknowledgement notification |
| Confirmed | Whether the device is asked to acknowledge receipt. Defaults to No |
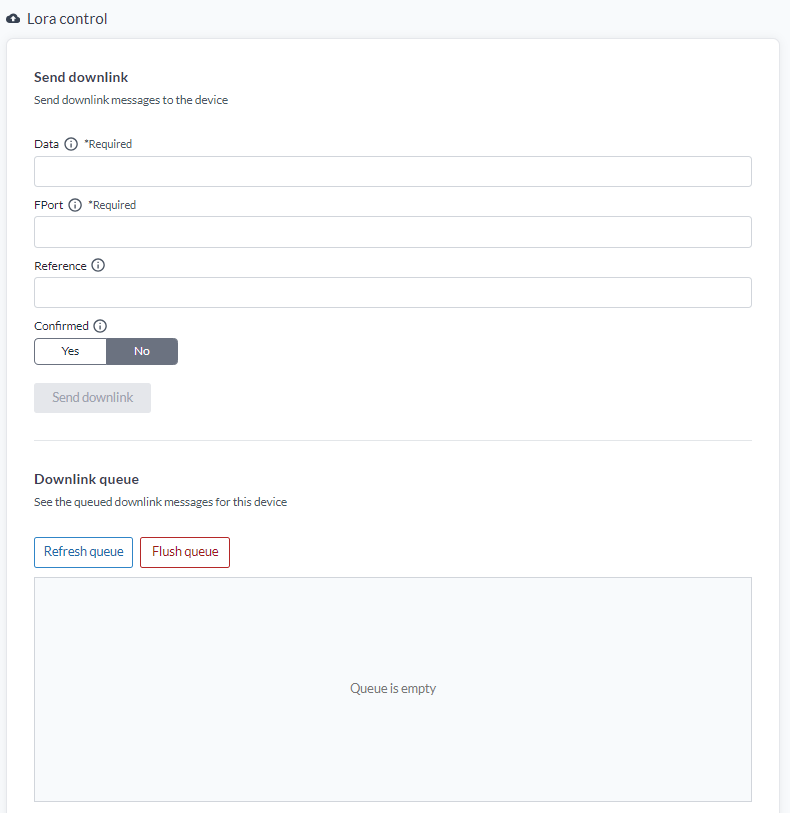
What to put in Data and FPort comes from the device's manual. Yggio passes the bytes through unchanged, so what they mean is defined by the device's firmware. The manufacturer's documentation is the only place that says which bytes do what, and which port to send them on. Yggio holds no list of payloads to pick from.
When it actually gets sent
Yggio hands the downlink to the LoRaWAN network server, which sends it to the device when the device can receive it. That depends on the device class:
- Class A - the device only listens briefly after it transmits, so the downlink waits in the queue until the device's next uplink. On a sensor reporting once an hour, that is up to an hour
- Class C - the device listens continuously, so it goes out more or less immediately
Refresh queue shows what is still waiting, and Flush queue discards it - useful when the wrong payload has been queued on a device that will not report for a while.
Knowing whether it worked
Two different questions, and they need to be kept apart.
Did Yggio hand it over? The Logs record the downlink being passed to the network server.
Did the device receive it? Only if you set Confirmed to Yes. The device is then asked to acknowledge, and the result appears in the logs as either a success or a failure - with the Reference you supplied, if you set one, so you can tell several downlinks apart.
A successful acknowledgement means the device received the bytes. It does not mean the device understood them, accepted them, or did anything. A payload on the wrong port, or with a value the firmware rejects, is acknowledged exactly like a good one. To confirm the intended effect, look at what the device reports afterwards in Data.
Calculations
If this device is a calculated device, the calculation behind it is shown here: what it computes, its latest value, and which devices feed it. Nothing appears here for an ordinary device, whether or not it is used as a source by a calculation elsewhere.
See Calculations for what the types do and how to create one.
Report interval
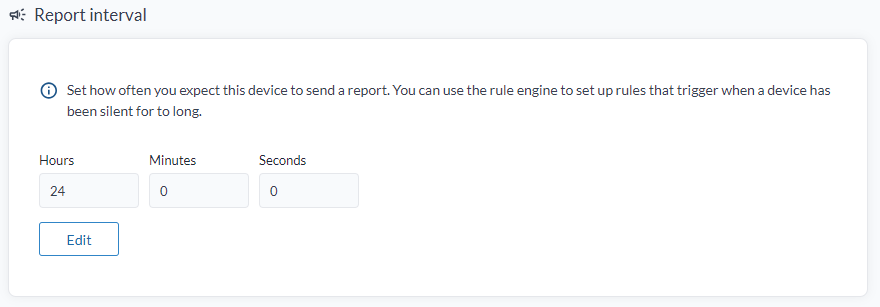
How often you expect this device to report, set in hours, minutes and seconds.
It does not configure the device
This is the part that is most often misread. Setting a value here changes nothing on the sensor. It tells Yggio what to expect, so that Yggio can notice when the sensor stops.
To change how often a sensor actually reports, you configure the sensor itself. Depending on the hardware that usually means one of:
- Sending it a downlink, from Commands or a rule
- Holding a phone against it and using the manufacturer's NFC app
- A physical setting on the device
The value here should match what the sensor is really configured to do. Give it some margin, a little longer than the true interval, so one lost message does not look like a failure. Radio messages do go missing occasionally.
What it gives you
When nothing arrives within the expected interval, Yggio raises a Missing Expected Report event in the alarm log. Without it, silence is invisible: a sensor with a dead battery, a failed gateway or a mounting that has been painted over looks exactly like one that has nothing to report.
The rule engine can act on that event - for example, an email or SMS to whoever maintains the site to say a device has probably failed.
To set the same interval across many devices, use Set Report Interval in Select many.
Tools
Troubleshooting for this one device. Tools is available when the device has a connector, or when it is a LoRa device.
Synchronization
"Synchronize device" forces contact with the device's integration - the LoRaWAN network server, or whichever system its connector talks to. "Last synchronization" shows when that last happened.

The outcome tells you where a fault lies when a device has gone quiet:
- It synchronises. The device is provisioned on the remote system and the connector can reach it. That rules out the whole integration layer, so if data still is not arriving, the problem is the device or the radio between it and the gateway
- It does not. Something is wrong between Yggio and the integration, and it is usually the connector: wrong or expired credentials, the wrong application or tenant, or a device that was never actually provisioned on the network server
Run it first when a device stops reporting. It tells you which side of the integration the fault is on before anyone drives out to the site.
For a LoRa device, Tools can also import devices from the LoRa server, fetching the devices it holds and creating them in Yggio.