Overview
The Devices section is where you manage everything connected to your account. It is built for one job: keeping a large number of devices under control. That means getting them in, finding the ones you care about, seeing their values at a glance, and drilling into a single sensor when something looks wrong.
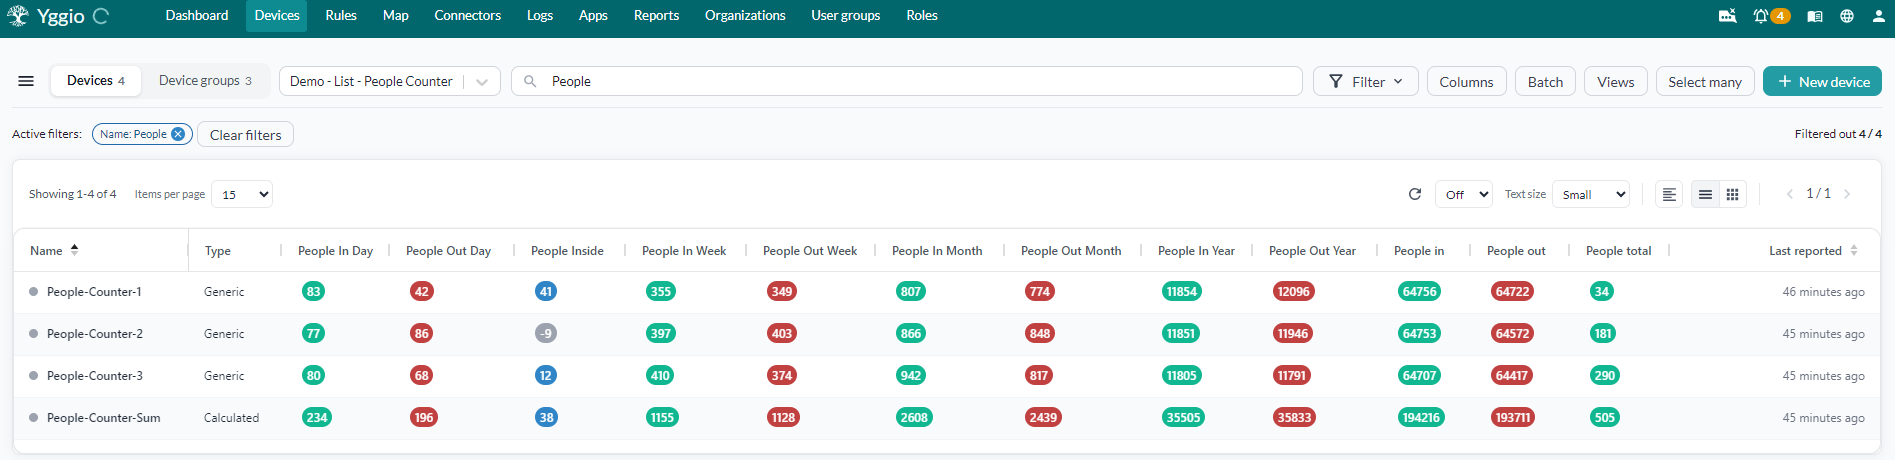
Everything below is a summary. Each section links to the page that covers it properly.
The pages in this section
| Page | Use it to |
|---|---|
| Device list | Find devices: search, filter, group, choose columns, page through |
| Device views | Save a set of columns and reuse it with one click |
| Device groups | Organise devices into named groups |
| Single install | Add one device through the interface |
| Batch install | Add or update many devices from a CSV file |
| Batch update | Change up to 1,000 existing devices from a CSV file |
| Select many | Act on a selection: 14 bulk actions |
| Device details | Everything about one device, in 14 sections |
| Charts | Plot values over time, across devices and fields |
| Calculations | Derive a new value and store it on a device of its own |
Getting devices in
First, a prerequisite: a device needs a connector. The connector is what carries the device's data into Yggio, and both install paths ask you which one to use. If you do not have one yet, start there - see Connectors - and come back once it is set up.
How you add devices depends on how many you have.
- Single install walks you through one device in the interface, with help for each device type, its model name and its translators. Right for a handful.
- Batch install takes a CSV file and a guide that fills in everything common to the batch. Right for anything larger - and re-running the same file later is also the normal way to correct an installation.
Removing devices works from the same two places: one device from Device details, several from Select many. For a LoRaWAN device, deleting it from Yggio also decommissions it on the network server unless you clear "Delete external" in the confirmation.
Finding the devices you want
The device list is the working surface, and most of managing a large estate happens here. It carries the controls that turn thousands of devices into the dozen you actually want:
| Control | What it does |
|---|---|
| Search | Match devices by name and other text |
| Filter | Narrow the list by field values |
| Group by | Cluster rows by a shared value |
| Columns | Choose which values appear as columns |
| Views | Switch between saved column sets |
| Table and grid view | Swap between a dense table and a card layout |
| Items per page, paging | Control how much loads at once |
| Interval update | Refresh values automatically |
| Text size, device count | Fit more on screen, and see how many matched |
Shaping what you see
Columns are how a list of names becomes useful data. Put temperature or desk occupancy in a
column and the values are there without opening anything.
A device view saves the whole list state under a name: the filters, the columns and their widths, the colour coding, the sorting, the refresh rate and the rest. The data you are interested in is then one click away, already filtered and already laid out. Keep one per job: commissioning, daily monitoring, one per building.
Views can also be exported as JSON for another user to import, or shared with an organisation. A view also decides what an export contains, which matters before a batch update: a field that is not in the view does not reach the CSV file.
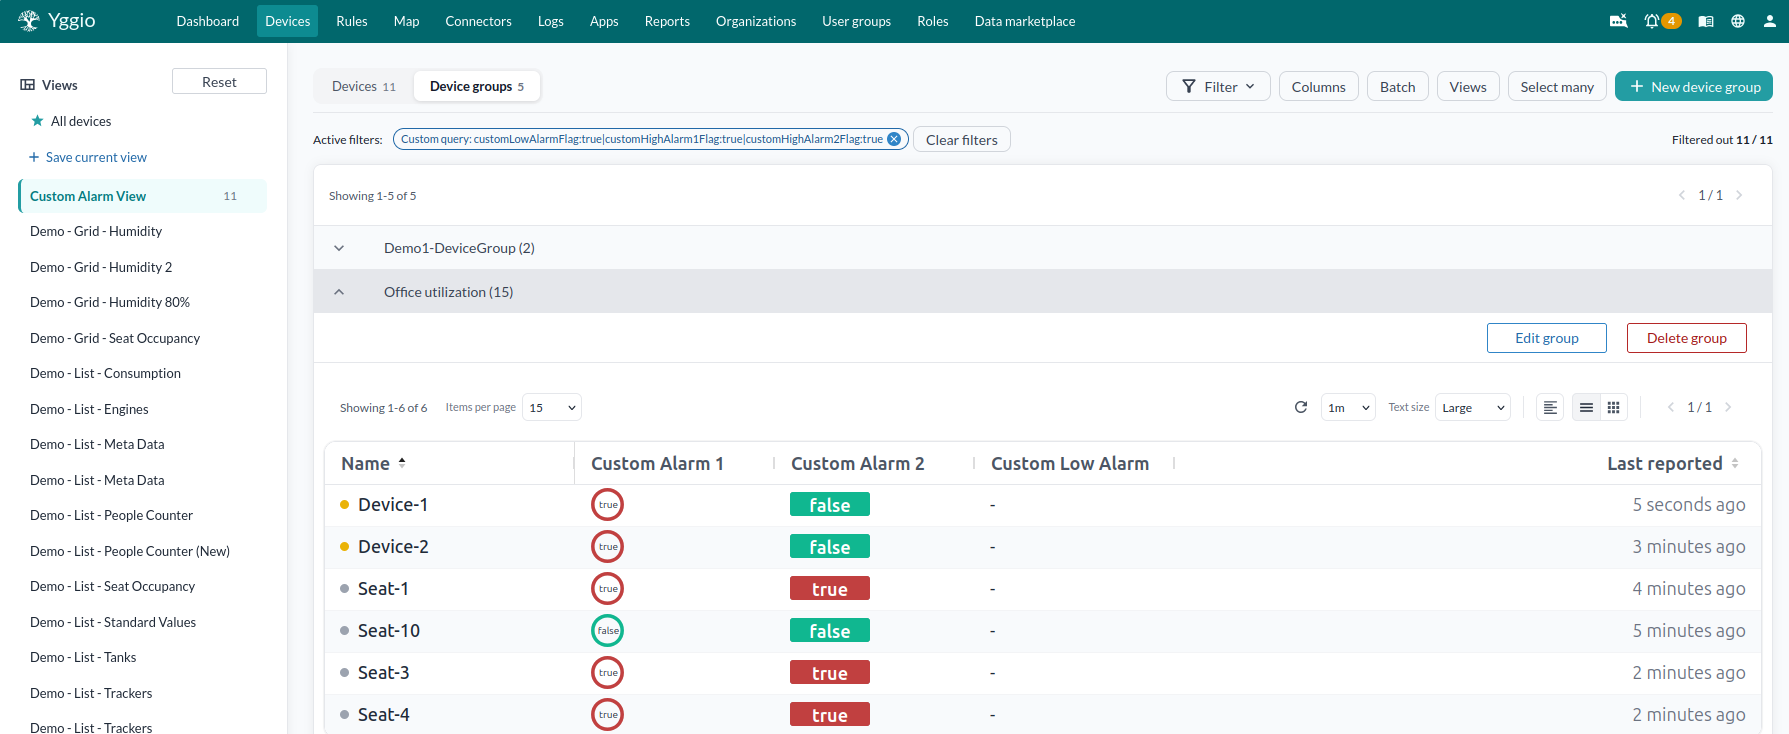
Device groups organise devices by something that is not a value - a building, a customer, an installation round. A group can be opened as a unit, and selected as one.
Drilling into one sensor
Press a device and the details panel opens beside the list. This is where a single sensor gets explained: what it is, what it last reported, what it has been doing and what is configured on it.
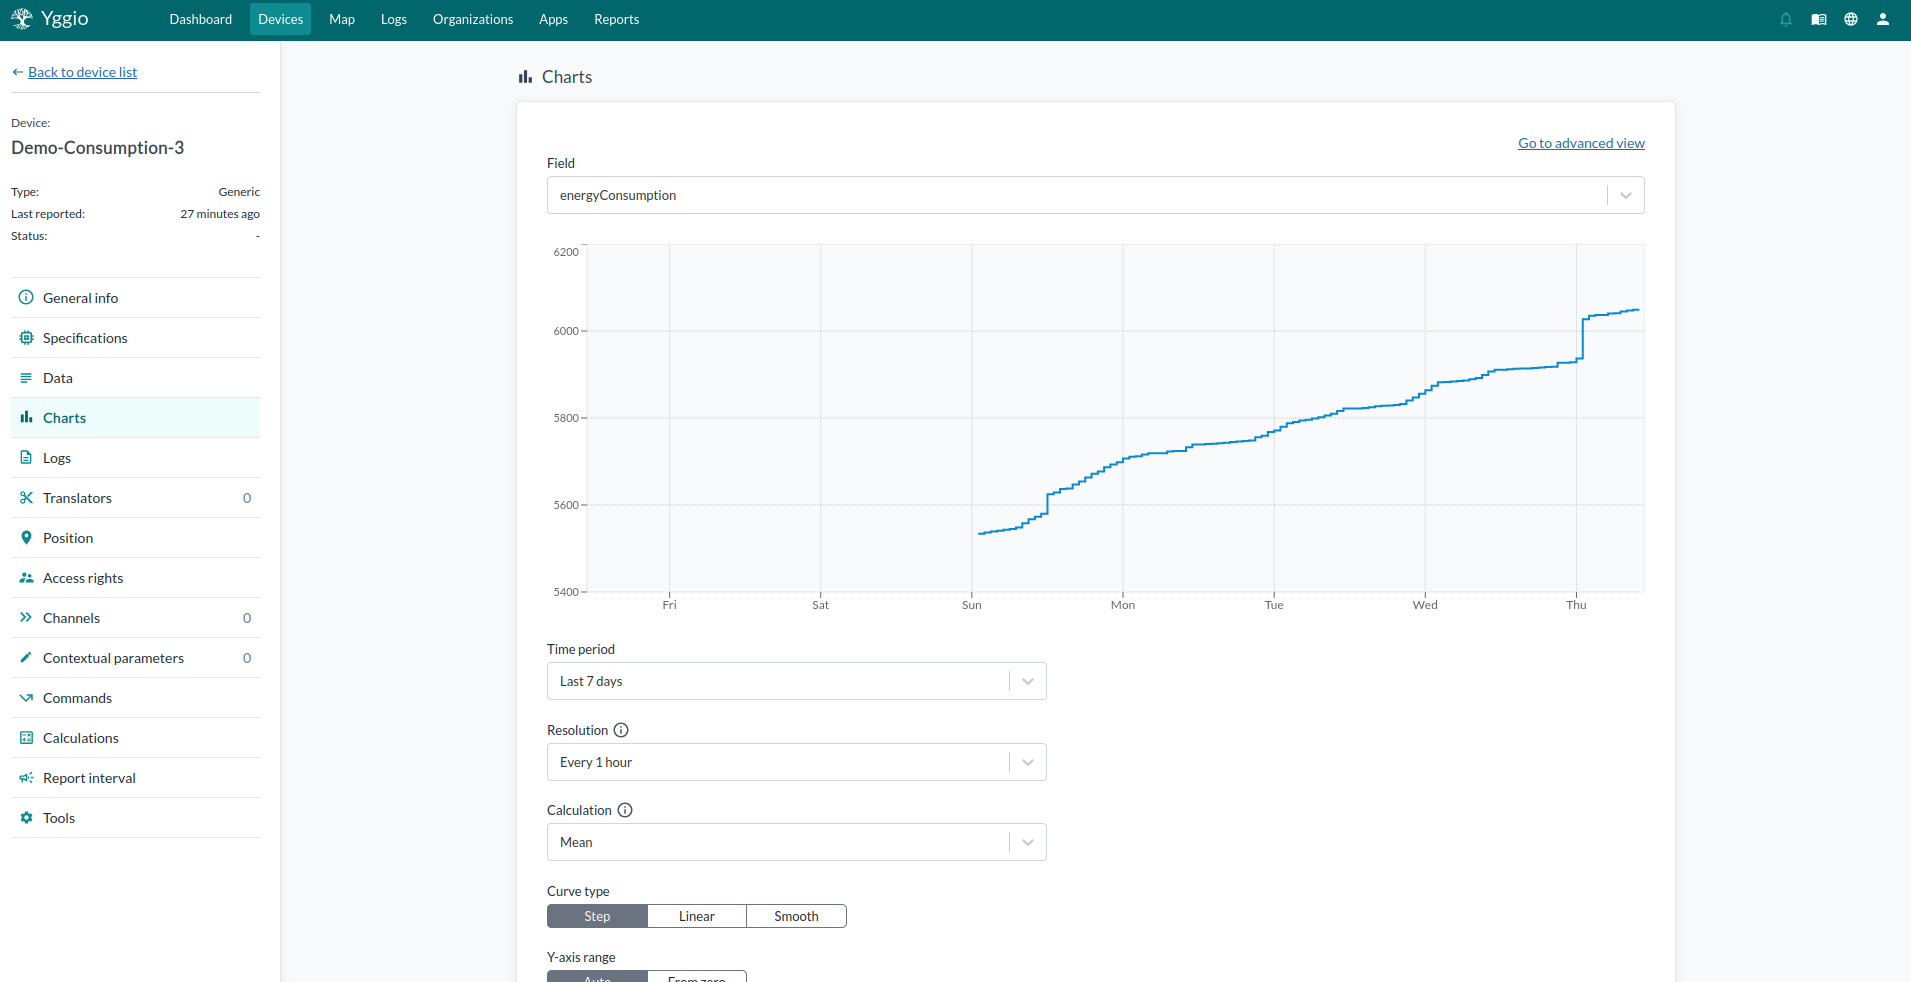
Device details covers fourteen sections, including general info and specifications, the reported data, per-device charts, logs, translators, position, access rights, channels, contextual parameters, commands, calculations, report interval and tools.
The usual path when something looks wrong: spot the odd value in a column, open the device, and check Data for what arrived. Logs and Translators then explain why it looks like that.
Seeing values over time
A column shows the latest value; a chart shows the shape of it. Charts plot one or more fields over time for several devices at once, so a sensor that has drifted is obvious next to its neighbours. Use Advanced to compare different kinds of time series in one chart.
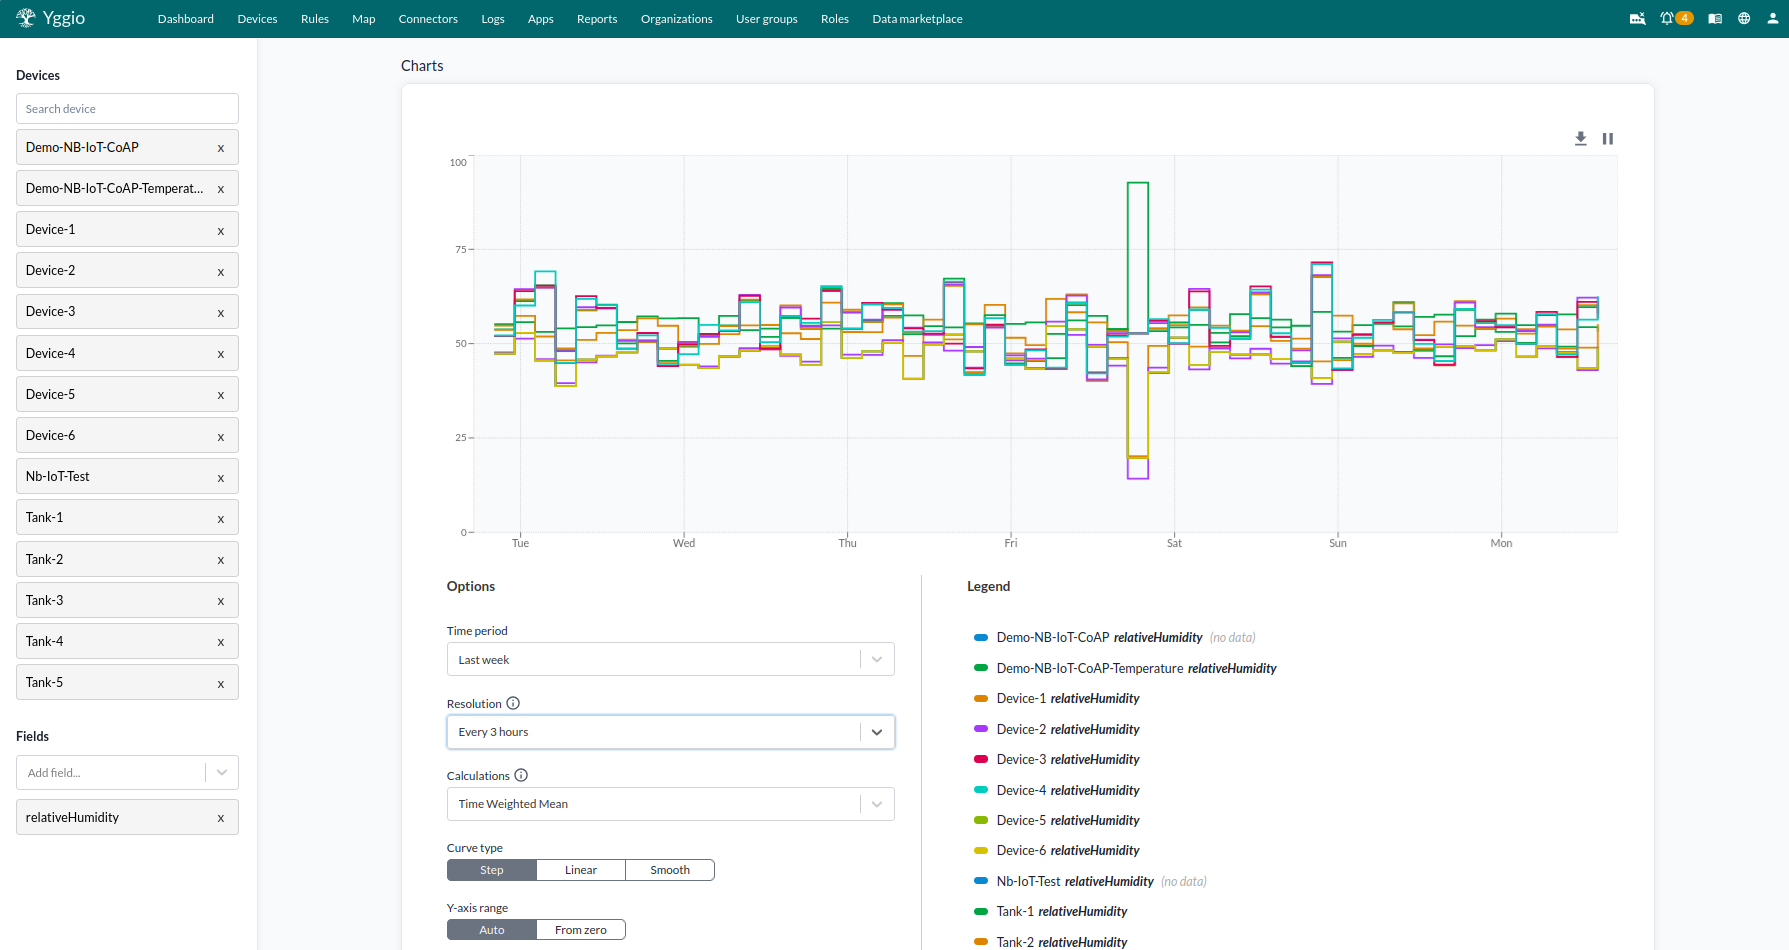
Charts opened from the device menu are for looking, not keeping - they cannot be saved. For something you want to return to, put it on a dashboard.
Deriving new values
A calculation turns values several devices report into one new value: an average temperature for a floor, the total consumption of a group of meters, the rate a tank is draining. The result is stored on a calculated device.
That device then behaves like any other. It can be charted, filtered, and put in views and dashboards, and it can carry a translator. An alarm on "the average is too high" is an alarm on an ordinary device.
Changing many devices at once
Select devices in the list, or select a group, and Select many offers fourteen actions on the selection: access rights and ownership, add to a device group or a floor plan widget, calculate, channels, charts, configure, delete, edit, edit translators, export to file, set connector, set report interval and synchronize.
Some changes are too detailed to make through a dialog - renaming hundreds of devices, or correcting metadata across an installation. For those, export the selection and use batch update, which applies up to 1,000 devices' worth of edits from the CSV file you send back. If you still have the file you installed with, re-running it through batch install does the same job without an export.