Calculations
A calculation derives a new value from values devices already report: the average temperature across a floor, the total consumption of a group of meters, the rate at which a tank is draining. The result is stored on a device of its own, a calculated device.
That device then behaves like any other. It appears in the device list, it can be charted and put in views, dashboards and reports, and it can carry translators. An alarm on "the average is too high" is an alarm on an ordinary device.
Two types of calculation
The first choice you make is the type, and it decides what the calculation compares.
| Type | Compares | Produces |
|---|---|---|
| Last value based | The latest value from each of the selected devices, against each other | One calculated device for the whole selection |
| Window based | Consecutive values from one device, against each other over time | One calculated device per selected device |
That difference matters when you select devices. Selecting ten devices and choosing a last-value calculation gives you one device holding, say, their average. Selecting the same ten and choosing a window calculation gives you ten calculated devices, each following its own source over time.
Last value based
Every calculation runs on the last value each device reported, and re-runs when a new value arrives.
- Mean: The average value of the last reported values from all devices included in the calculation.
- Min: The minimum value of the last reported values from all devices included in the calculation.
- Max: The maximum value of the last reported values from all devices included in the calculation.
- First: Of the last values from each device, the one that was reported first.
- Last: Of the last values from each device, the one that was reported most recently.
- Count: The number of devices involved in the calculation.
- Sum: The sum of the last value from each device.
- Difference: The difference between the last reported values from each device. Typically used to measure the gap between two sensors, for example loss between an inlet and an outlet.
Window based
These run over a moving window of one device's own readings, so they answer "how is this value changing?" rather than "how do these devices compare?".
- Difference: The difference between consecutive values within the window. Useful for the change amount between reports, for example consumption per period on a meter.
- Derivative: The rate of change over time across the window. Useful for how fast a value is rising or falling, for example a temperature drifting or a tank draining.
A window calculation has three extra settings:
| Setting | What it does |
|---|---|
| Time granularity | The sampling resolution used when aggregating readings. Second, minute or hour |
| Window mode | Range counts samples, Time counts duration |
| Range, or Time with a unit | With Range, the number of samples in the window. With Time, the length of the window in the unit you choose. Both must be greater than 0 |
Create a calculation
Calculations are created from the device list, on a selection of devices. The wizard has three steps: Calculation, Measurement and Create.
-
Go to the Device List and press "Select Many".
-
Select the devices whose values the calculation should use. Only devices that report the measurement you are after are worth selecting; the measurement list further down is built from what the selected devices actually have.
-
Press "Select Action", then "Calculate".
-
Choose a type, Last value based or Window based. This is the choice that decides whether you get one calculated device or one per source, so see Two types of calculation if you are unsure.
-
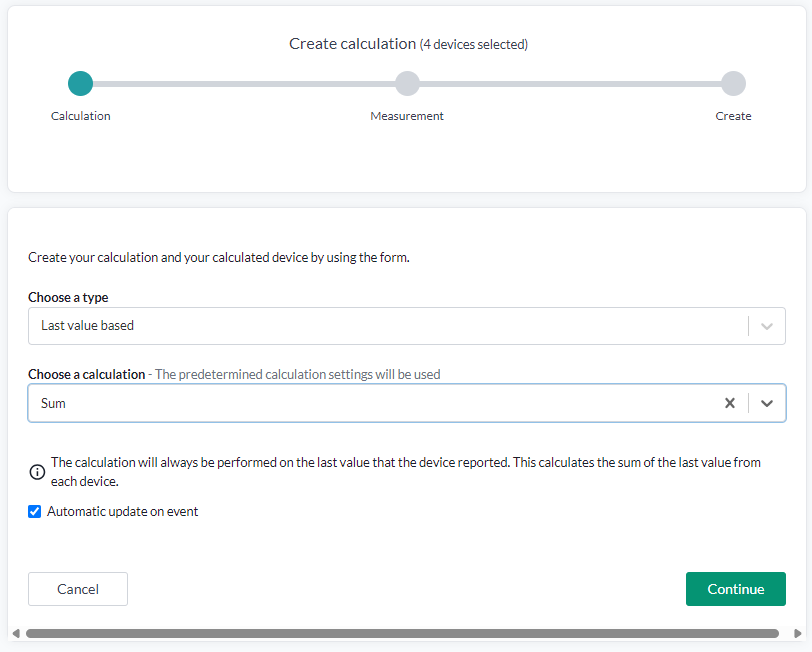
Choose a calculation, the method from the list for the type you picked. The panel explains the method you selected, as with Sum below. Leave "Automatic update on event" ticked unless you have a reason not to: ticked, the calculation re-runs each time a source device reports, and unticked it runs periodically instead. Press "Continue".
The heading confirms how many devices you brought in, four in this example, so check that before going on.
-
Choose a measurement, the value to calculate on, for example
temperature. The options come from the values your selected devices carry, so a measurement only appears if the selection reports it. If the list is empty or missing what you expected, go "Back" and reconsider the selection. Continue stays disabled until a measurement is chosen.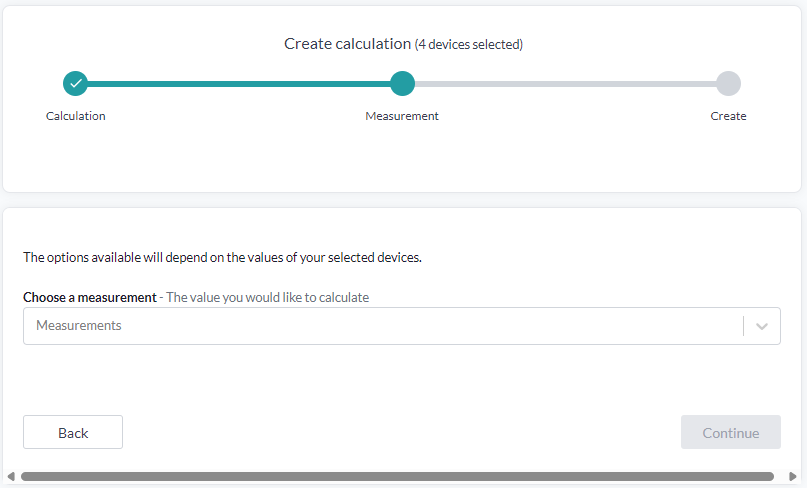
-
For a window calculation, also set Time granularity and Window mode, then either the Range (number of samples) or the Time and unit. These do not appear for a last-value calculation.
-
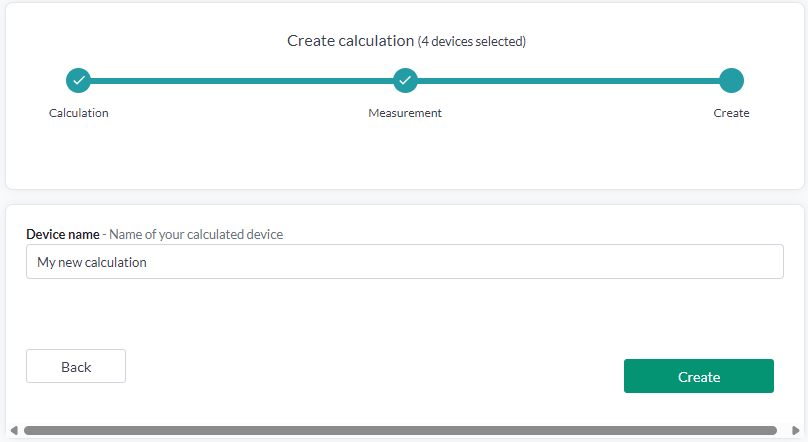
Name the calculated device, up to 50 characters. This is what you will see in the device list, so name it for what it represents rather than for the method: "Office 3 average temperature" rather than "mean temperature". Press "Create".
After it is created
The calculated device appears in the device list like any other. Open it and the Calculations section shows the calculation, its latest value, and which devices feed it.
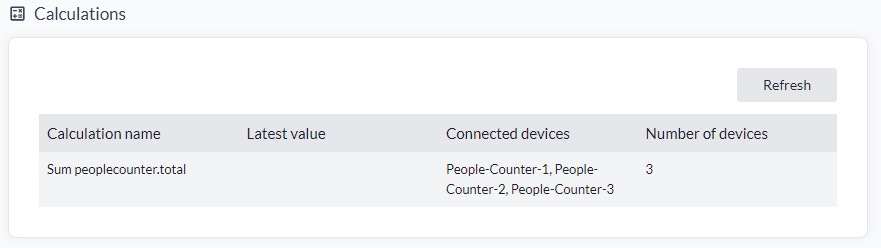
The calculation gets its own name from the method and the measurement, "Sum peoplecounter.total" above, so it does not match the device name you typed. The device is what you named; the row is what it does.
A calculation does not backfill. It uses data reported after it was created, so a new calculated device holds nothing until its sources report again. Press Refresh to pick up what has arrived since you opened the page.
From there it is an ordinary device. Chart it, add it to views, dashboards and reports, or put an alarm translator on it to be warned when an average goes out of range.
If you made a window calculation, remember that it produced one device per source: ten selected devices means ten new devices, each named from the name you entered.
⚠️ Reminder:
For cases involving conditional logic, filtering, or custom thresholds, use a data flow or translator instead of calculated nodes.For calculations across a large number of devices, a translator is also the better option. The translator feature Additional Device Update scales better than calculated nodes, because it works on incoming events rather than on stored time series data.
Use cases
Common use cases
Temperature & Environment
- Average temperature across a room, building, or multiple buildings (
mean) - Maximum or minimum temperature in any monitored area (
max,min) - Average indoor air quality score across floors or offices (
mean) - Average humidity in a warehouse zone or production floor (
mean)
Energy & Utilities
- Total energy consumption for a room, floor, building, or campus (
sum) - Water consumption per city, per area, per floor, zone, or building (
sum) - Water loss detected between two sensors in a pipeline (
difference) - Change rate of water volume in wells during rainfall or post-drainage (
mean) - Total volume across multiple tanks or silos (
sum) - Average tank fill level across storage units (
mean)
Occupancy & Usage
- Seat occupancy count per area or building (
sum) - Seat utilization ratio (
meanoccupancy / total capacity) - Meeting room utilization percentage across a zone (
mean) - Total usage time of shared assets or spaces (
sum) - Device message count (e.g., total number of updates received) (
count)
Specialized use cases
Some of these more advanced use cases may require an additional translator to preprocess or transform the raw data-such as inverting values or applying custom logic-before it can be used in a calculated node. When used in Reports, the final adjustments to a KPI can also be handled with an Excel formula, allowing for greater flexibility and presentation control.
HVAC and Indoor Climate
- Temperature gradient between rooms or floors (
difference) - Differential pressure between two points in a ventilation system (
difference) - Average CO₂ level during occupancy hours only (
mean, time-filtered) - CO₂ trend speed over a defined period (
rate of change) - Max temperature drift per hour (e.g., sudden HVAC failures) (
rate of change) - Average daily cooling/heating demand derived from setpoint vs actual temp (
mean of difference) - Minimum air flow rate in ventilation system per zone (
min)
Energy Optimization & Fault Detection
- Peak power usage during working hours (
max, time-windowed) - Night-time power leakage in unused zones (
sum, with condition) - Abnormal energy consumption detection (baseline vs actual,
difference) - Power factor analysis across industrial devices (
derived metric) - Solar production vs consumption delta per hour (
difference)
Industrial & Manufacturing
- Cycle time average across machines or production lines (
mean) - Downtime calculation based on status flag or activity absence (
countgaps) - Max pressure drop across filters (use
maxdifference from reference) - Maximum load recorded on industrial machinery (
max) - Cooling fluid loss over time (
difference, with starting value) - Average vibration amplitude per hour or shift (
mean)
Water Management & Environmental Monitoring
- Evaporation rate from open reservoirs (
rate of change) - Average rainfall vs inflow correlation across pump stations (
mean, across sensors) - Total overflow events in combined sewer systems (
count) - Water level delta before/after storm event (
difference) - pH value drift over 24 hours (
rate of change, smoothed)
Space Utilization & Smart Building
- Real-time capacity ratio of a co-working area (
current occupancy / capacity) - Time-weighted average occupancy per day (
mean, weighted) - Utilization heatmap input by aggregating movement sensor data (
sum) - Percentage of unused desks over time (
inverse meanoccupancy) - Meeting room idle time ratio (
differencebetween reserved and used)
Logistics & Smart City
- Average package flow through a zone (
count, normalized by time) - Number of garbage pickups missed (
expected - actual) - Traffic congestion index using travel time deltas (
difference) - Noise pollution average during nighttime (
mean, night hours only) - Vehicle charging station utilization rate (
active sessions / total ports)