Excel Reports
Generate an Existing Report
This guide explains how to generate an existing report using the platform's built-in reporting tools. The process is simple and intuitive once you're familiar with the steps.
⚠️ Note:
The Excel engine uses the Microsoft Graph API to generate reports. During this process, the report data is temporarily stored in the platforms Office 365 account and is automatically deleted a while after the report is finalized. For Excel reports to function properly, the platform must be able to access the Microsoft Graph API endpoints at https://graph.microsoft.com/. If you would prefer the platform to use your own Office 365 account instead, please contact your support representative to explore integration options.
Step 1: Access the Reports Section
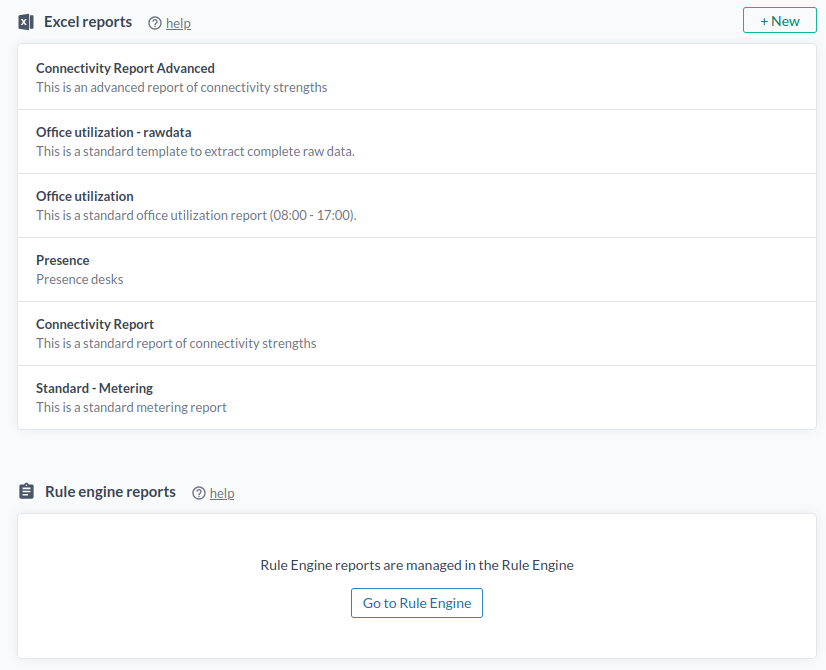
Navigate to the Reports section in the user interface.
![]()
Step 2: Select a Report
In the Reports section, you'll see a list of available reports — these can include reports you've created, as well as reports shared with you via the Organisation Manager.
Click on the report you want to generate.
Step 3: Generate the Report
Opening a report will display four tabs:
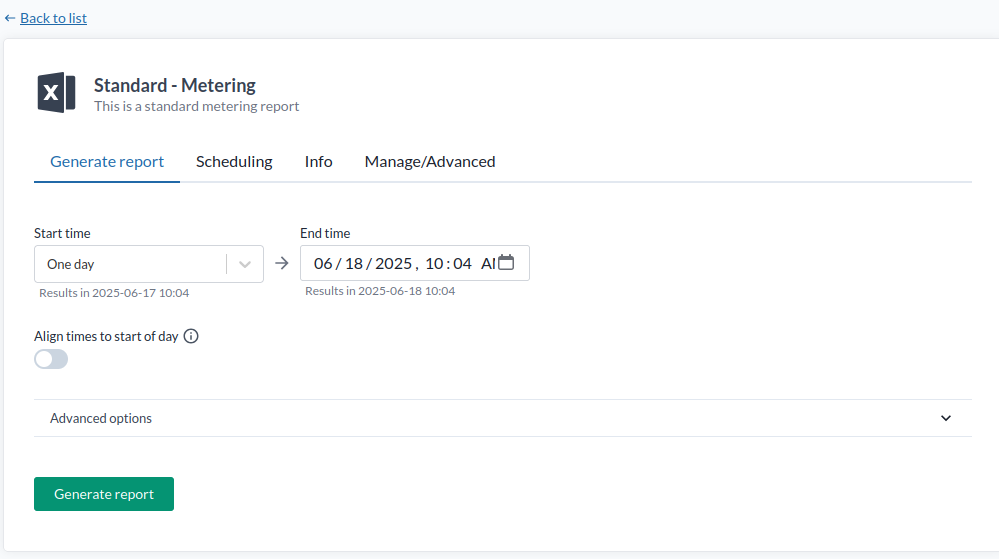
Generate
- Select a start and end time for the data you want to include.
- Click Generate to start processing.
- After a short delay, a live preview of the report will appear.
- Click the preview to download the Excel file.
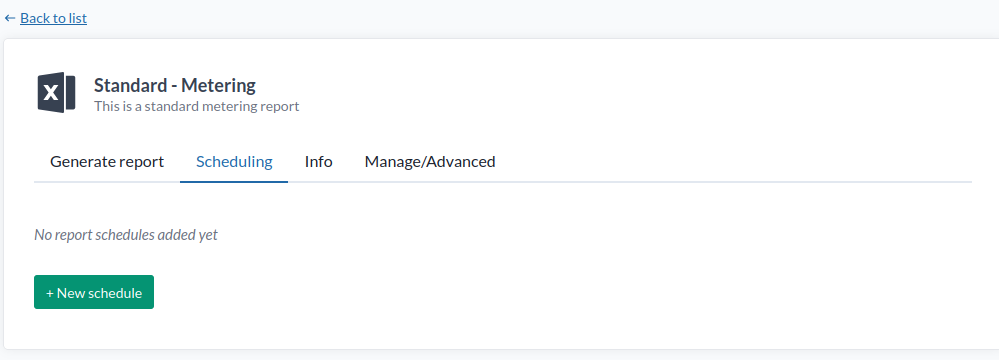
Scheduling
Use this tab to set up automatic report generation and email delivery.
Recipients are configured under:
Rule Engine → Contacts
This is where you define who should receive scheduled reports or rule-based notifications.
Manage / Advanced Info
This tab gives you access to the Report Base — a JSON definition that tells the platform which raw data to include in the Excel report before formulas are applied
. For examples see the Standard Report Bases below.
By following these steps, you can easily generate reports based on your custom Report Base configuration. Enjoy streamlined reporting and automated Excel report generation!
Standard Reports
These are the standard Excel reports that can be reused directly for basic reporting.
For a detailed guide on how to create reports go to traning material.
For developers go to reports.
You can use the following report base templates to create the standard reports. Go to Reports and click "New", then copy and paste the desired report template and click "Create". You now have a standard report to work from.
For a more detailed walkthrough—including how to automate report delivery—refer to the training material.
Metering Report
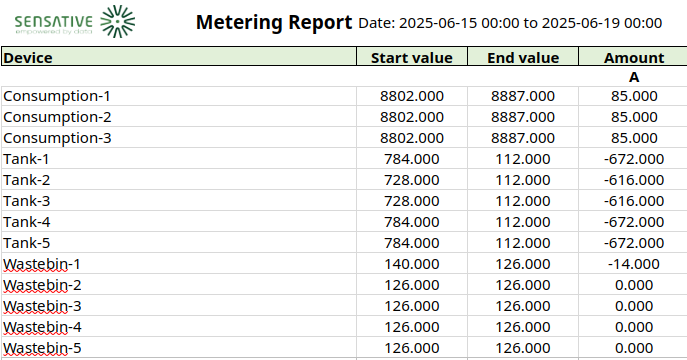
The metering report measures monthly consumption of energy and/or water, depending on which devices you have access to during that period. To adapt the report to your sensors, update the query and measurement field. The firstAndLast value function makes sure no measurement is missed at the transition between two months.
Report Base
{
    "name": "Standard - Metering",
    "type": "timeseries",
    "description": "This is a standard metering report",
    "fileName": "Standard-Metering",
    "timeZone": "Europe/Copenhagen",
    "secondsBetweenPoints": 86400,
    "fillMethod": "previous",
    "sources": [
        {
            "valueFunction": "firstAndLast",
            "query": "currentVolume",
            "fields": [
                {
                    "name": "currentVolume",
                    "prettyName": "Meter value"
                }
            ]
        }
    ]
}
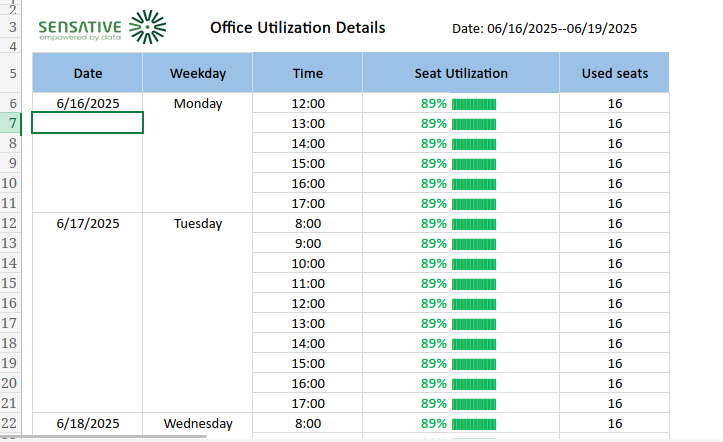
Office Utilization Report
The office utilization report measures seat usage over the selected period, depending on which devices you have access to during that time. To adapt it to your sensors, update the query and measurement field. The max value function means that if a seat was used at any point during an hour, it counts as used for the full hour. You can also use min to track the lowest value, or mean to measure average usage during each hour.
Report Base
{
    "name": "Office utilization",
    "type": "timeseries",
    "description": "This is a standard office utilization report (08:00 - 17:00).",
    "fileName": "Standard-Office-Utilization",
    "timeZone": "Europe/Copenhagen",
    "secondsBetweenPoints": 3600,
    "fillMethod": "previous",
    "sources": [
        {
            "valueFunction": "max",
            "query": "presence",
            "includeOnly": [
                "contextMap",
                "presence"
            ],
            "fields": [
                {
                    "name": "presence",
                    "prettyName": "Presence"
                }
            ]
        }
    ]
}
Connectivity Report
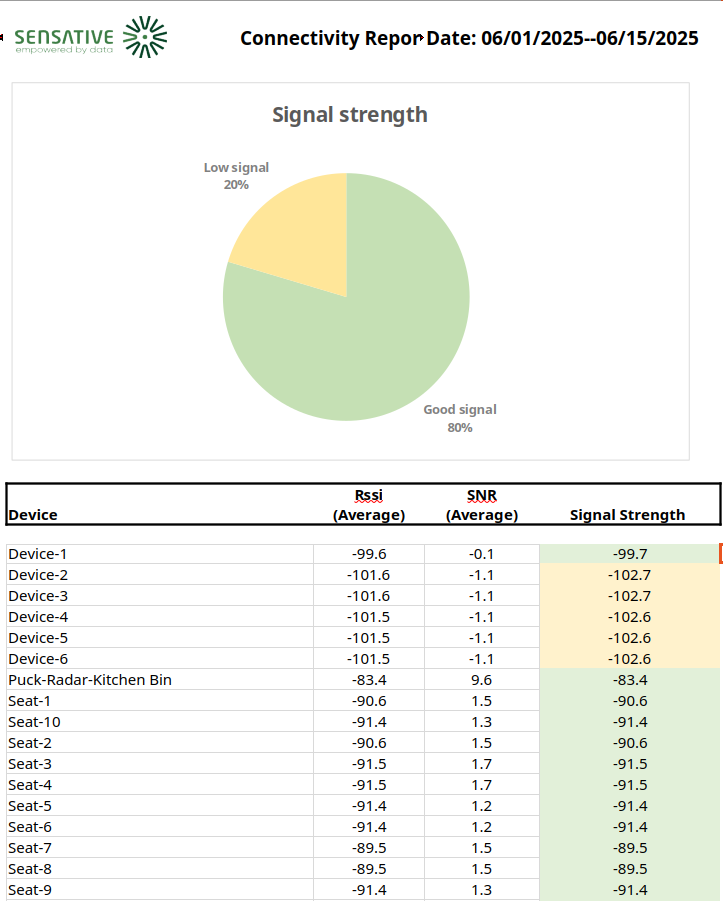
The connectivity report measures signal strength over a selected period for devices that match the query requirements. It's used to assess the quality of your LoRaWAN network. Poor signal quality can lead to significantly higher battery consumption—often twice as much or more—compared to devices with good signal strength.
Report Base
{
    "name": "Connectivity Report",
    "type": "timeseries",
    "description": "This is a standard report of connectivity strengths",
    "fileName": "Standard-Connectivity",
    "secondsBetweenPoints": 86400,
    "sources": [
        {
            "valueFunction": "mean",
            "query": "rssi",
            "includeOnly": [
                "name",
                "rssi",
                "snr"
            ],
            "fields": [
                {
                    "name": "rssi",
                    "prettyName": "Rssi"
                },
                {
                    "name": "snr",
                    "prettyName": "SNR"
                }
            ]
        }
    ]
}
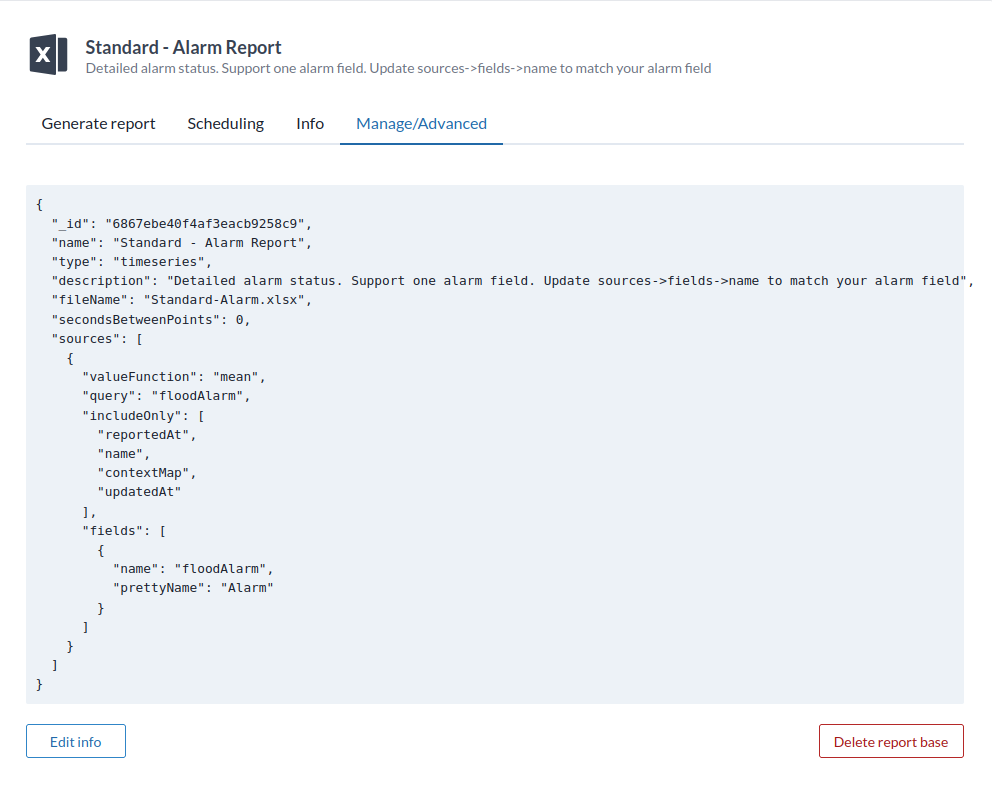
Alarm Report
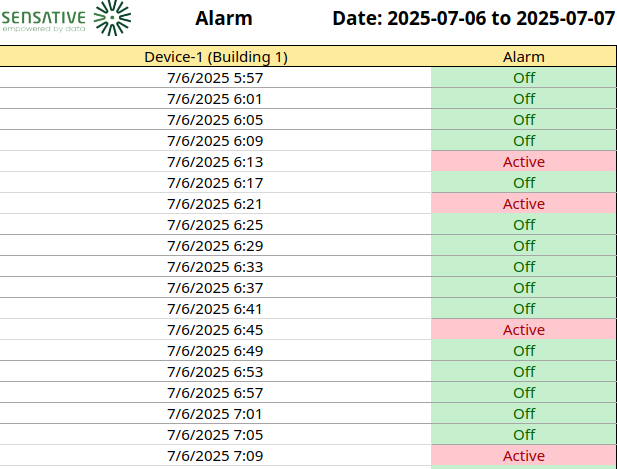
The alarm report is used for viewing the alarm history. You can change the sources.fields.name to match the alarm you want to monitor.
Tip: If you want to monitor several alarms, create multiple reports—one per alarm.
Report Base
{
    "name": "Standard - Alarm Report",
    "type": "timeseries",
    "description": "Detailed alarm status. Support one alarm field. Update sources->fields->name to match your alarm field",
    "fileName": "Standard-Alarm",
    "secondsBetweenPoints": 0,
    "sources": [
        {
            "valueFunction": "mean",
            "query": "floodAlarm",
            "includeOnly": [
                "reportedAt",
                "name",
                "contextMap",
                "updatedAt"
            ],
            "fields": [
                {
                    "name": "floodAlarm",
                    "prettyName": "Alarm"
                }
            ]
        }
    ]
}
Using an Existing Report as a Template
To create a custom report based on an existing one:
-
Click "Advanced option" and enable "Include raw data" when generating a report.
This ensures the Excel file includes all raw data and formulas. -
Download the generated report and use it as a template.
-
Modify the report in Excel as needed.
⚠️ Excel knowledge is required. Primarily related to "Dynamic Arrays" and formulas lika FILTER, SORTBY, TOCOL, BYCOL, BYROW, LAMBDA, XLOOKUP, XMATCH, INDIRECT, VSTACK and HSTACK. Refer to Microsoft Excel documentation for guidance.
-
Log in to Swagger.
-
Go to
Reports → uploadFileand upload your modified report.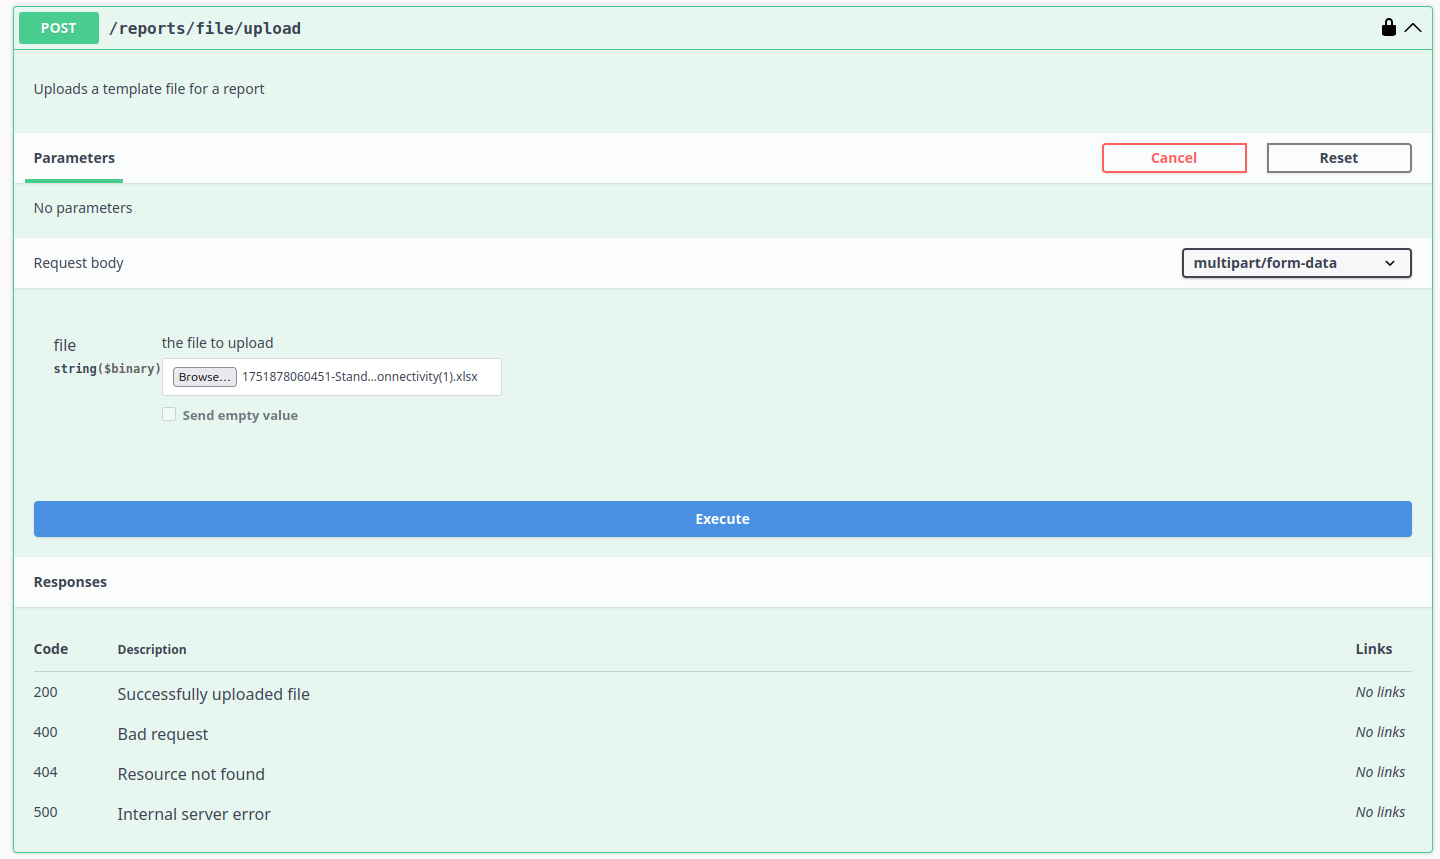
-
The response will include a file name — use this as your report base filename in future report configurations.
For more detailed instructions, see the training material.