Lesson 2.3 Excel Reports
Excel Reports are generated using the platform’s built-in report engine and exported as .xlsx files. These reports can visualize a wide range of data—such as metering, office utilization, alarms, and more.
This lesson will take you step-by-step through creating a report based on a standard report, as well as how to customize or build your own report template using Excel skills.
Note: The Excel engine is designed to handle large volumes of data points within a single report.
Step 1 – Create a New Report
- Go to Reports and click New.
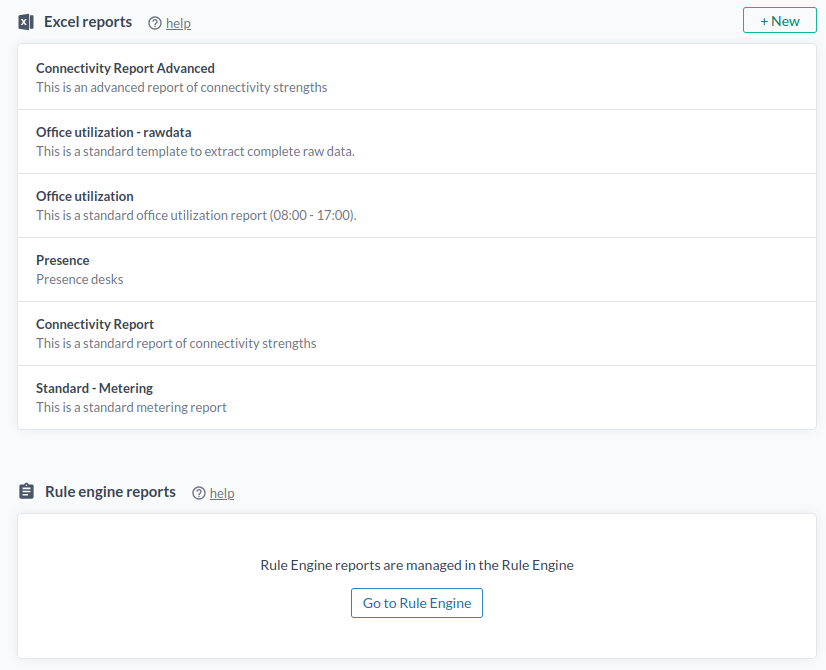
- Select a report from Reports.
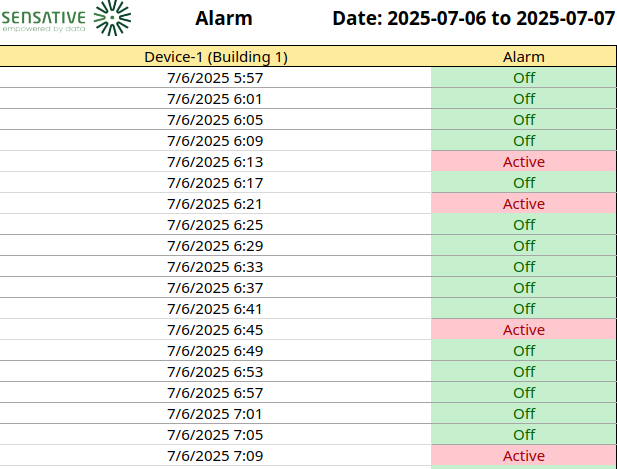
In this guide, we’ll use the Standard - Alarm Report. To do that:
- Scroll to the Report Base section below.
- Copy the JSON snippet.
- Paste it into the Create New Report Base field.
- To customize the alarm tracked by the report:
- Open your device’s Data tab.
- Locate the alarm field—either from an alarm translator (e.g.,
floodAlarm) or directly from a sensor. - Replace
floodAlarmin the report base JSON with your own alarm field name.
To track multiple alarms, the simplest method is to create separate Alarm Reports. Alternatively, modify the Standard Alarm Report to support multiple alarm fields.
Customize the Report Base (Manage / Advanced Tab)
The report base, definition of data to include in the report
{
    "name": "Standard - Alarm Report",
    "type": "timeseries",
    "description": "Detailed alarm status. Support one alarm field. Update sources->fields->name to match your alarm field",
    "fileName": "Standard-Alarm.xlsx",
    "secondsBetweenPoints": 0,
    "sources": [
        {
            "valueFunction": "mean",
            "query": "floodAlarm",
            "includeOnly": [
                "reportedAt",
                "name",
                "contextMap",
                "updatedAt"
            ],
            "fields": [
                {
                    "name": "floodAlarm",
                    "prettyName": "Alarm"
                }
            ]
        }
    ]
}
Edit the info found in the 'Manage/Advanced' tab to suit your needs
| Parameter | Description |
|---|---|
name | Name of the report base (e.g., "Connectivity Report") |
secondsBetweenPoints | Time interval between data points in seconds |
timeZone | Timezone to use — see the TZ database |
valueFunction | Aggregation method to apply on all data between the interval time: mean, min, max, first, last, difference, count, sum, firstAndlast |
Example – Data Aggregation
Given:
- Hour 1:
2, 5, 6, 4 - Hour 2:
1, 4, 7, 3
| valueFunction | Hour 1 Calculation | Hour 1 Result | Hour 2 Calculation | Hour 2 Result |
|---|---|---|---|---|
mean | (2 + 5 + 6 + 4) / 4 | 17 / 4 = 4.25 | (1 + 4 + 7 + 3) / 4 | 15 / 4 = 3.75 |
min | Smallest value = 2 | 2 | Smallest value = 1 | 1 |
max | Largest value = 6 | 6 | Largest value = 7 | 7 |
first | First value in list = 2 | 2 | First value in list = 1 | 1 |
last | Last value in list = 4 | 4 | Last value in list = 3 | 3 |
firstAndlast | First value = 2 | 2 | Last value = 3 | 3 |
difference | Last value - previous last (0) = 4 | 4 | Last value - previous last (4) = -1 | -1 |
count | Number of values = 4 | 4 | Number of values = 4 | 4 |
sum | Sum: 2 + 5 + 6 + 4 = 17 | 17 | Sum: 1 + 4 + 7 + 3 = 15 | 15 |
Note:
- The
differencefunction calculates the current last value minus the previous last value. This is typically used to track changes hour-to-hour, day-to-day, or month-to-month—for example, monitoring energy consumption over time.- The
firstAndlastfunction includes data from the first and last selected days. Importantly, if you select the first and last day of a month (e.g., May), it also includes the last day of the previous month (e.g., April). This ensures no threshold values are missed at period boundaries, which is crucial for accurate metering reports.
Step 2 – Select Time Range and Generate Report
- Choose the Start Time — either a relative or custom date range.
You can enable RAW data under advanced options.
Click Generate to download the Excel file.
Step 3 – Schedule the Report
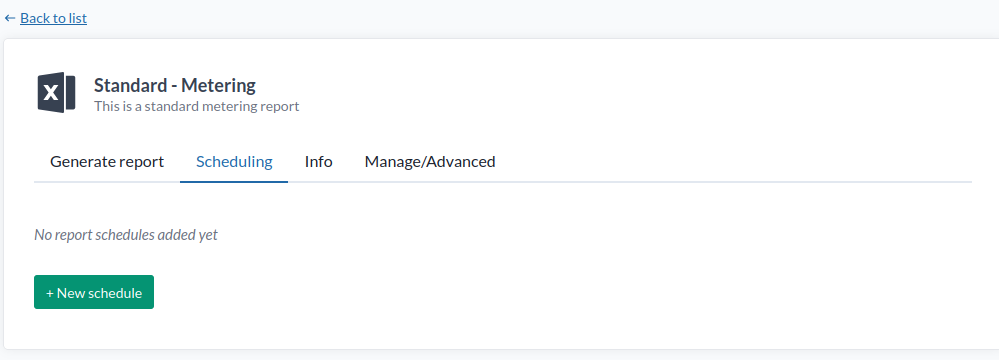
- Go to the Scheduling tab and click New Schedule.
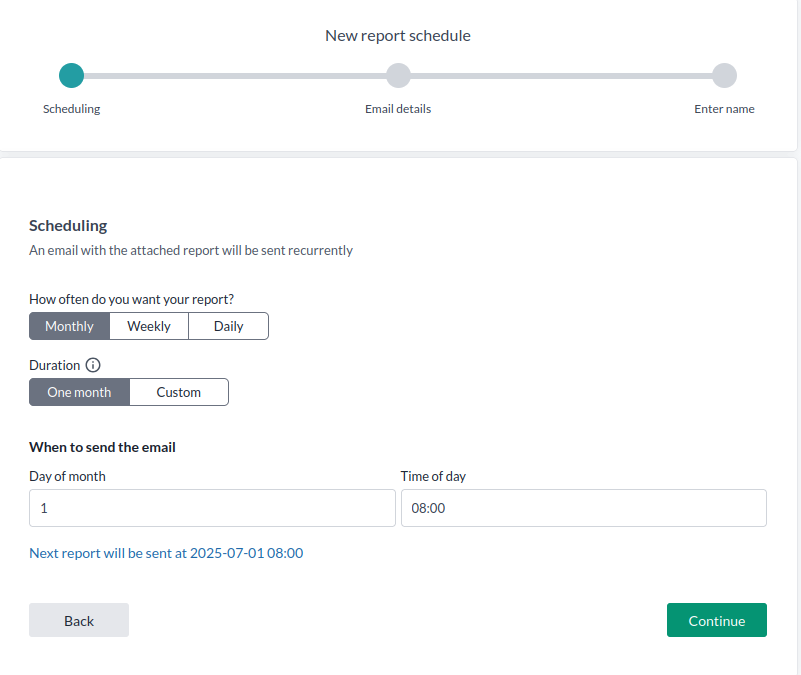
- Set how often to send the report:
- Monthly
- Weekly
- Daily
-
Choose a Duration (e.g. 1 month, 1 week, 1 day, or a custom value in seconds).
This controls how far back in time the report data goes. -
Choose when to send the report and click Continue.
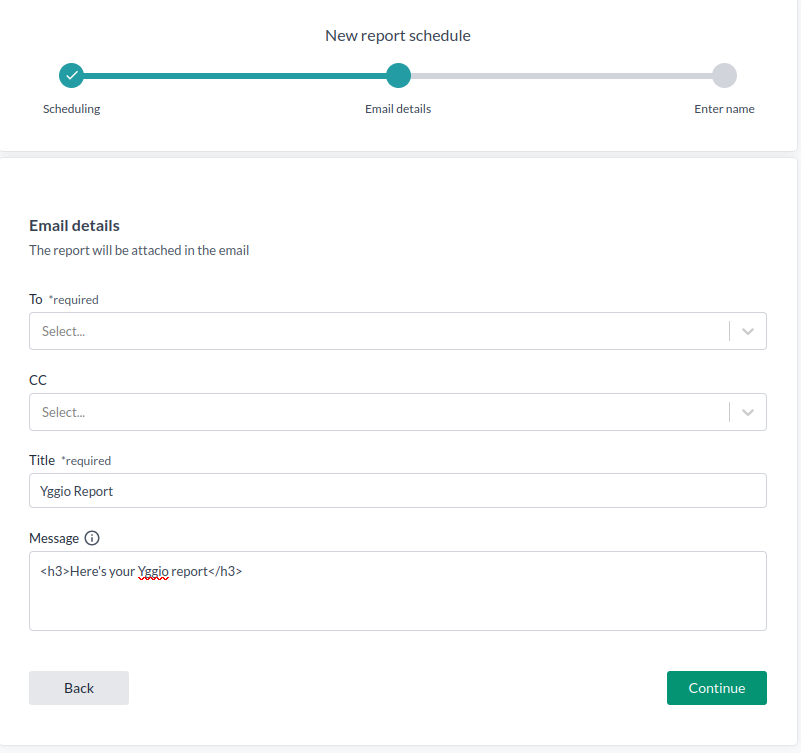
- Fill in the recipient fields:
- To
- CC
- Email subject/title
- Body message (HTML supported)
- Click Continue, name your schedule, and finish.
Step 4 – Creation and Uploading of a Custom Excel Report
Interested in a custom report?
Developing a report requires some technical proficiency, including:
- Defining queries, value functions, data resolution, and field mappings in the report base configuration to extract the wanted data from the platform.
- Creating Excel templates that handle variable data volumes.
- Managing date/time formatting and layout scalability for dynamic datasets.
The best way to understand custom reports is to review the existing standard reports and read the Developer Guide, along with Microsoft Excel’s documentation. If your organization requires custom reports beyond what you can create in-house, Sensative can provide support tailored to your needs.
Principles
To successfully customize an Excel report, you must be comfortable working with dynamic and variable datasets. The number of data points and IoT nodes can vary depending on:
- The selected time period
- The query used and the number of devices accessible to your account
This variability requires formulas, charts, and layouts that adapt flexibly to changing input.
Key Excel Features & Functions
The following Excel functions are commonly used to process platform data dynamically:
FILTERSORTBYXLOOKUP,XMATCHTOCOLBYCOL,BYROWwithLAMBDAto manage the dataINDIRECT,ADDRESSVSTACK,HSTACK
These functions enable dynamic iteration, filtering, and reshaping of incoming data.
Learn from Existing Reports
Study the formulas and structures in the Standard Reports to understand best practices for working with dynamic data in Excel.
For additional support, refer to the Microsoft Excel documentation.
Guide to Modifying the Report Template in Excel
After downloading a report, customize it in Excel by following these steps:
1. Understand the Raw Data
- Open the sheets named
timeseriesRawDataandiotnodeRawData.
These contain the raw time series data and IoT node metadata provided by the platform. The data has been filled in according to the time period selected by the user and the instructions and formatting specified in the reports "Report Base". - If you change the Report Base for the report the data in these two sheets will change
- If you change the time period amount of data will either increae or decrease.
From here on it is pure Excel skills to generate the final Report.
2. Analyze the Calculation Sheet
- Review the formulas on the
calcssheet. - This sheet performs data preparation: cleaning, reshaping, and organizing raw data into a format suitable for the final report.
3. Handle Date Formatting Carefully
- Platform timestamps are provided in UTC by default.
- Excel uses a Microsoft-specific datetime format, which may cause incorrect or unreadable dates unless properly formatted.
- Adjust date formatting by specifying the
encodingandtimeZonekeys in the Report Base definition, e.g.,encoding: "en-US"andtimeZone: "Europe/Stockholm".
Note: All platform servers use "en-US" encoding.
This means that before uploading a template, any date fields in the Excel file must be formatted asyyyy-mm-dd HH:MM.
During report development, you should use your local date format so that Excel correctly interprets the values as dates.
Summary:
- Use local formatting during development.
- Change to
yyyy-mm-dd HH:MMformat before uploading.
Refer to the Standard Reports for an example of proper date handling.
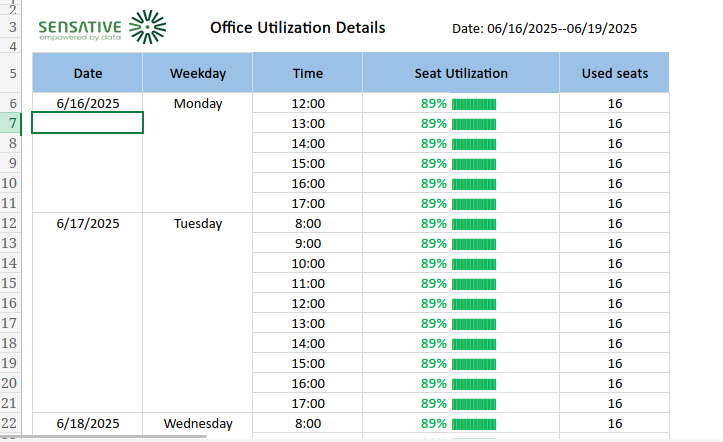
4. Customize Visual Appearance
- Edit the final report sheet(s) intended for end users.
- Adjust colors, layout, headers, and other visual elements to align with your branding and ensure scalability with varying data volumes.
5. Understand What Happens at Runtime
- When a report is generated, intermediate sheets such as
timeseriesRawData,iotnodeRawData, andcalcsare automatically removed. - Only the final output sheet(s) remain, and these contain static values with all formulas stripped out.
Ensure that your final report sheets include everything necessary, as all intermediate calculations will be lost.
Log In to Swagger
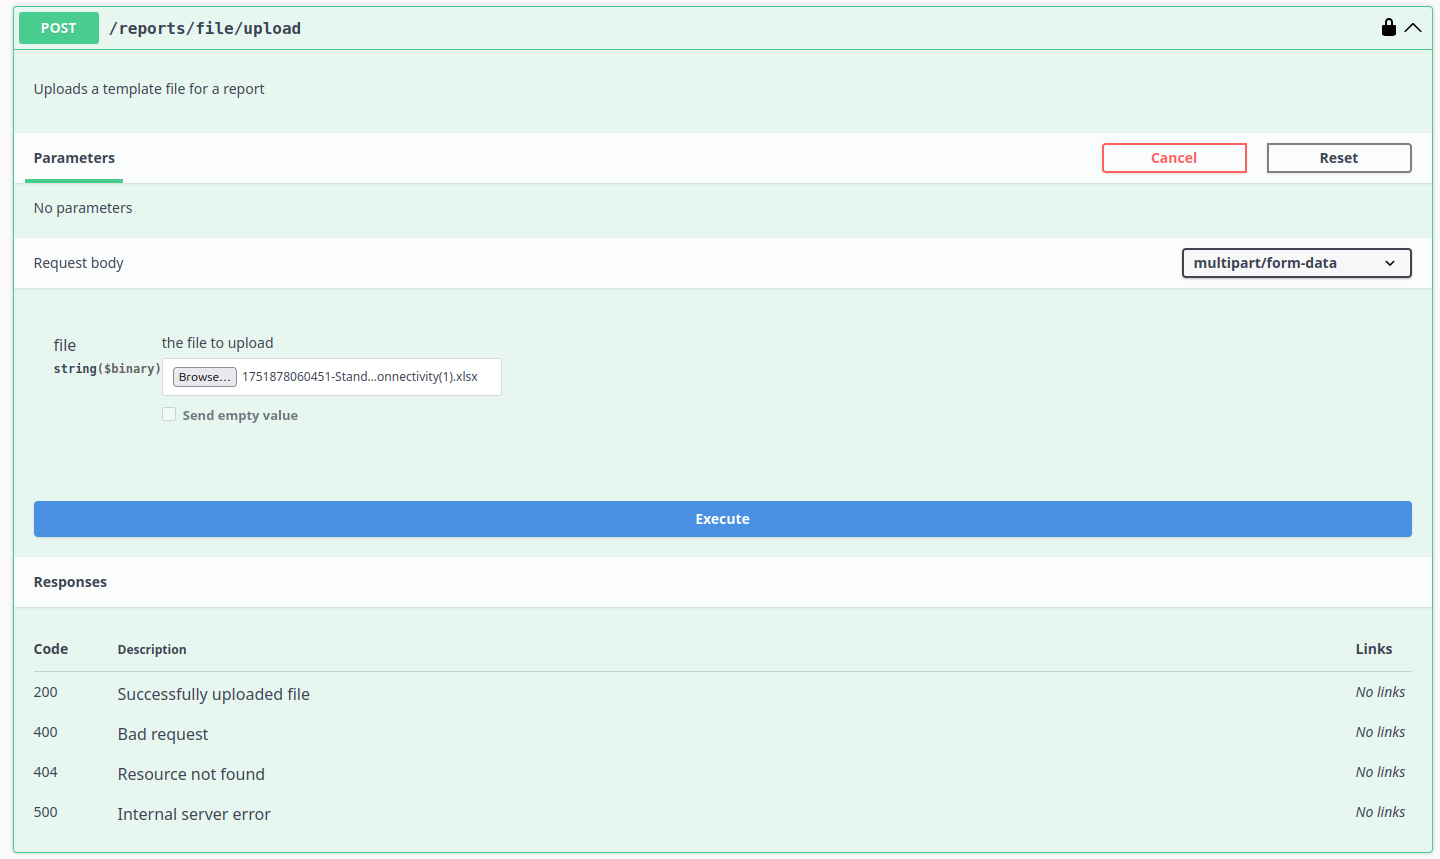
Upload the Report Base
- Navigate to Reports → UploadFile.
- Upload your modified
.xlsxreport template.
Use the Response Filename
- After uploading, the response will return a filename.
- Use this filename as the report base filename in your configuration or API requests.
Modify the Report Base to Use Your Custom Template
- Return to the Platform Reports UI.
- Open your report and go to the Manage / Advanced tab.
- In the Report Base JSON, update the
filenamefield with the returned filename.
Typically, the filename begins with your username, followed by your uploaded file name, for example:
username_customTemplate.xlsx.
This instructs the platform to use your custom Excel template when generating the report.
- Question
- Answer
Why should you use Excel reports?
Excel reports are ideal when you need dynamic, customizable, and readable results directly in the exported file.
Unlike CSV or HTML reports, Excel reports can:
- Contain formulas and calculations
- Automatically adjust to variable data sizes
- Include charts, conditional formatting, and KPIs
- Be branded and laid out for stakeholder-ready presentation
- Enable automated insights without post-processing
In contrast, CSV is raw and requires further work. HTML is readable but fixed.
Excel gives you the best of both: raw data + logic + formatting — all in one export.
- Question
- Answer
Can I edit the Excel report after download and expect the platform to update it?
No. The downloaded Excel report is a static snapshot of your data up to the report’s generation time. Any edits you make are local and won’t sync back or update with new platform data. It’s a fixed, point-in-time copy—not a live, dynamic view.