Lesson 1.3 Alarm translators
Alarm Translators are primarily used for threshold-based supervision but can also use algorithms and mathematical logic for more advanced monitoring.
This lesson is a step-by-step guide to apply Alarm translators to devices and then set up suitable Views for supervision. To create reports of alarms see Lesson 2.3 Excel Reports templates.
Add Alarm Translators
To monitor values and trigger alarms when readings become too high or too low, you can add alarm translators to your device. The thresholds are configured either in the translator settings or via contextual parameters. The available fields will become visible once an uplink has been received.
Naming convention
- set-alarm-[alarmField]-from-[inputField]
Examples
-
set-alarm-temperature-from-temperature
→ SetstemperatureHighAlarmbased on supervision of the field temperature -
set-alarm-temperature-from-average-temperature
→ SetstemperatureHighAlarmbased on supervision of the field averageTemperature -
set-alarm-custom-from-custom-field
→ SetscustomHighAlarm1Flag,customHighAlarm2FlagorcustomLowAlarmbased on supervision of a custom field specified in the translator settings
Steps
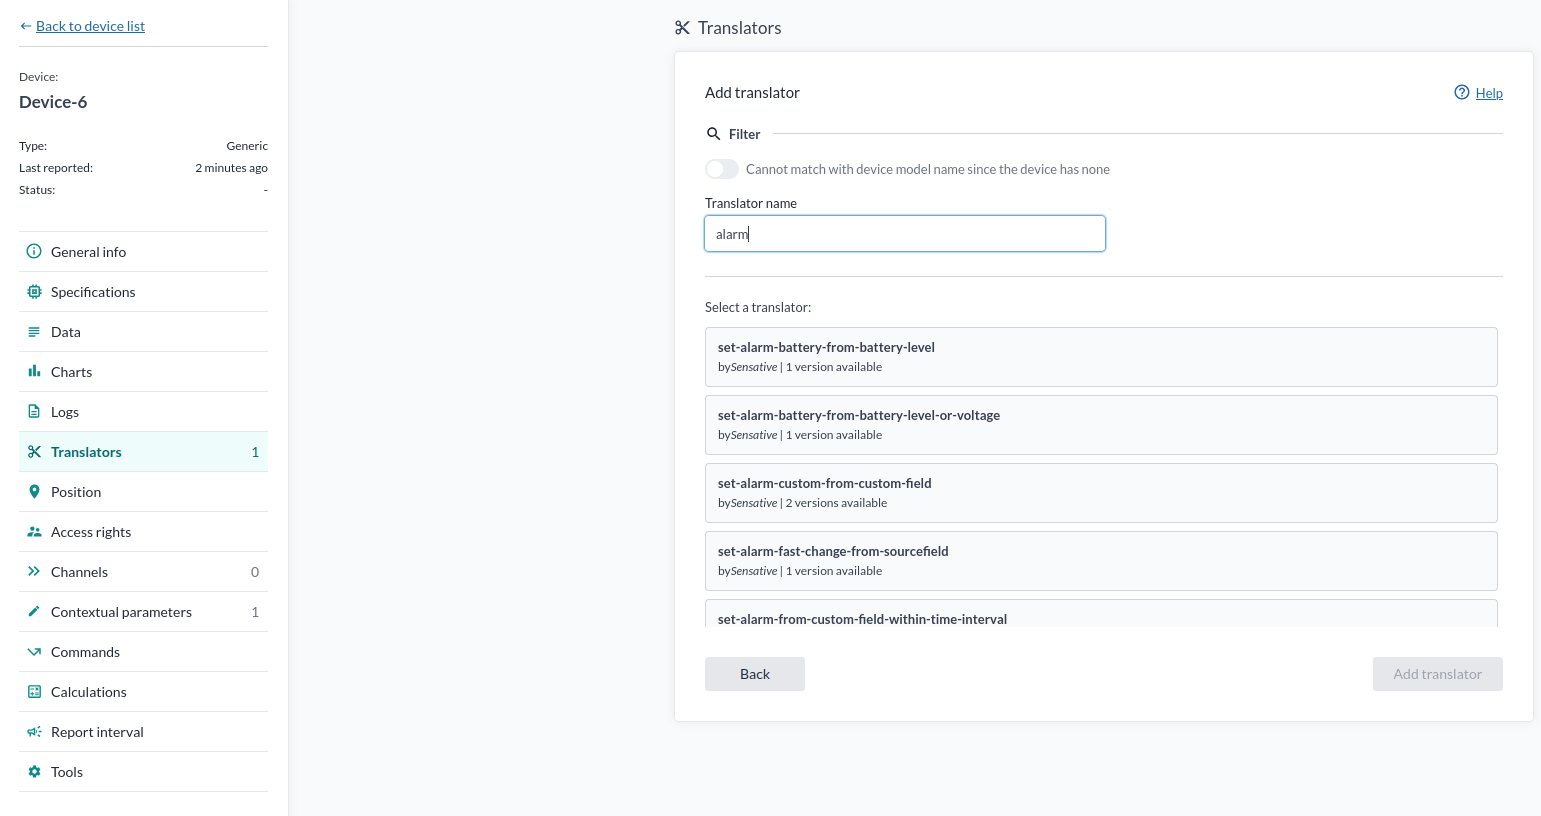
-
Go to Translators
You can do this from:- The device menu
- Select Many
- Or while creating a device
-
Click "Add Translator"
- Pick the Value to Monitor
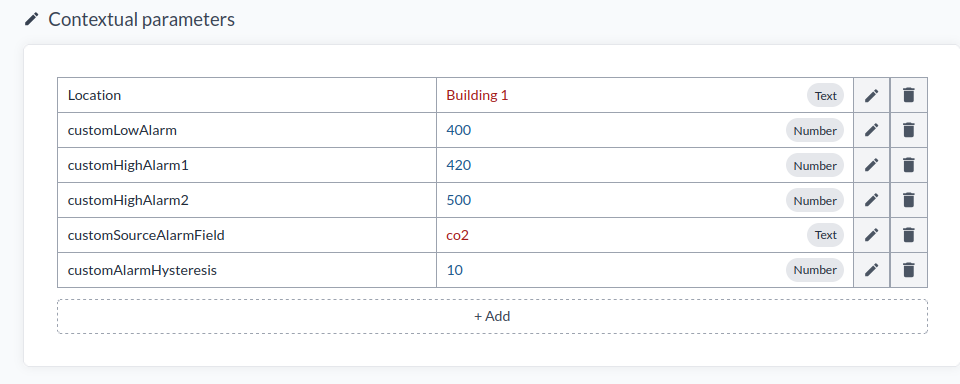
Go to the Data tab, find the value you want to monitor, and copy its name.
Then head to Contextual Parameters and paste it in there.
-
Edit the Other Parameters
Adjust thresholds, trigger values, and anything else you need. -
Done!
Once the device reports in again, you’ll see new fields show up in the Data tab.
Alarm Monitoring View
With the alarm translator data, you can create a custom view in Devices to monitor your alarms.
Once you have created an alarm translator, you’ll be able to track and visualize your alarms directly within the device view.
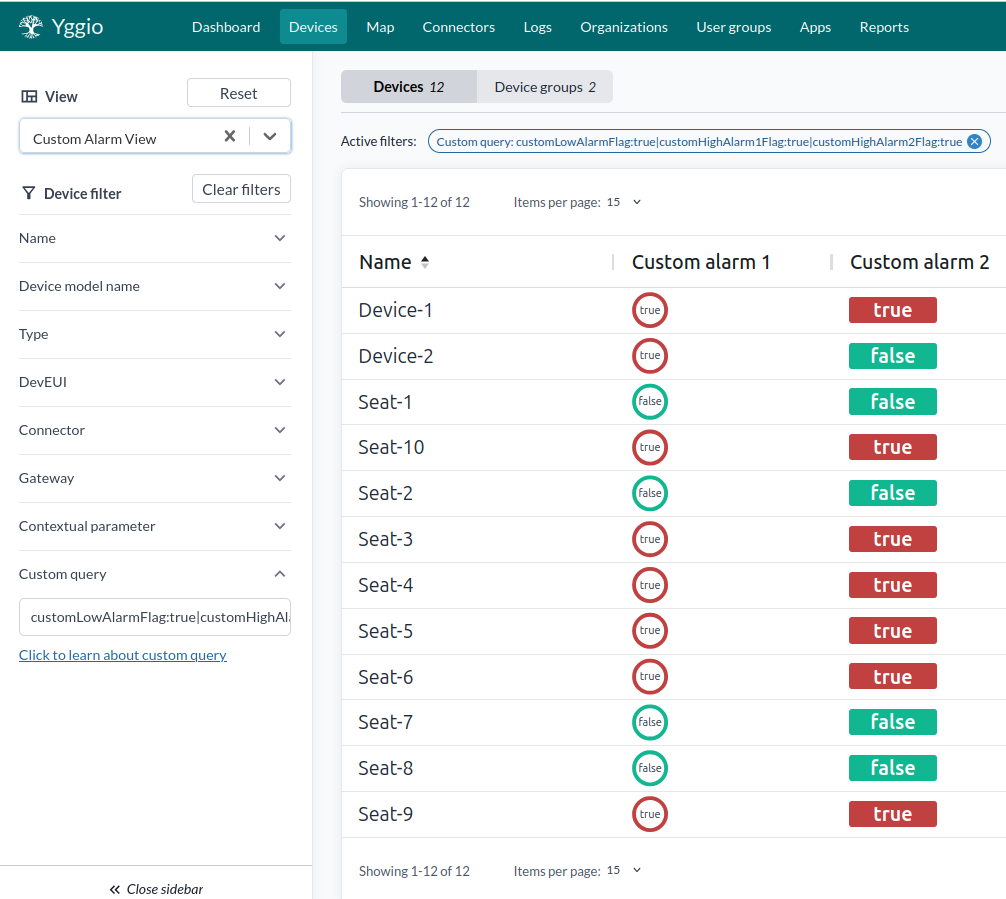
Example of an alarm monitoring view
Setting Up the Alarm Monitoring View
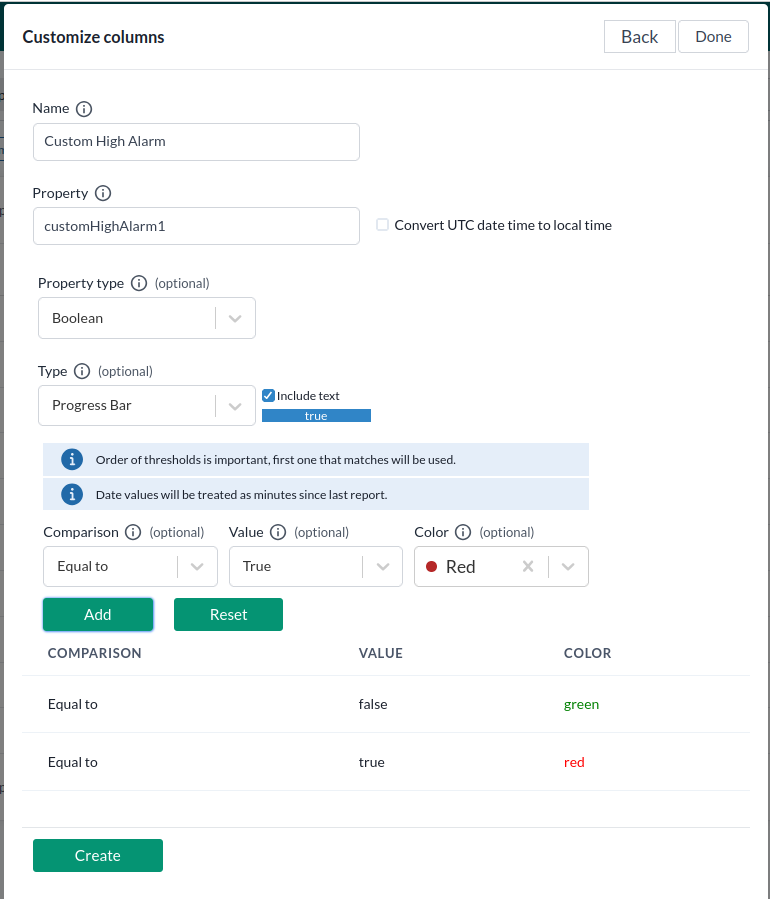
- Click "Customize Columns", then click "New".
Here you’ll set the parameters for how the alarm will be displayed.
Example:
-
Click "Create".
You can create additional column definitions if needed. -
In the Customize Columns menu, press "Columns", then select the column(s) you created and press "+" to add them.
You may need to repeat this step depending on how many columns you want to include.
Remove any columns you don’t want in the view. When finished, press "Done".
You can also reorder the columns into your preferred layout. -
Use the Device Filter section on the left to adjust search parameters to something more relevant.
You can use the Custom Query feature to filter devices with specific values or comparisons —
for example:
customHighAlarm1Flag == trueFor more information on custom queries, click the guide linked below the Custom Query input in the sidebar.
-
Then press "Views", go to the "Save" tab, give your view a name, and press "Save".
You can now access your saved view anytime by clicking "Views" in the left-hand sidebar.
Q&A
- Question
- Answer
Why do the platform use Alarm translators? Why not manage the thresholds in rule engine?
There are several strong reasons to use alarm translators instead of directly adding threshold values to the rule engine. These are the key reasons:
- Alarm translators easily add logic for hysteresis, which avoids the risk of getting many notifications if measurement values fluctuate around the threshold.
- Alarm translators are flexible. There are a number of standard alarm translators available, but they are released as open source and can easily be extended to include more advanced logic.
- The rule engine is stateless. If a measurement value exceeds a threshold, you will get a notification for every update of the measurement. This can be avoided by adding states to the rule engine, but that makes it more complex.
- With alarm translators, each threshold can be set and visualized individually per IoT node. This gives great flexibility and a good overview.
- Since the alarm becomes a simple true or false state, independent of the actual threshold value, it's enough to create one rule to manage alarm notifications for a very large number of measurements.
Summary:
Alarm translators provide great benefits in flexibility, overview, logic, ease of use, and configuration. Quite simply — a better UX!
- Question
- Answer
Why do you need hystersis?
If you were to set up the rule engine to send you an email each time the temperature surpassed 23 °C, and it was based on a translator, you would receive an email every time the threshold was crossed.
This would become a problem if the temperature fluctuated between 22.9 °C and 23.1 °C — you'd end up getting a whole bunch of emails due to the slightest changes.
This is where hysteresis comes in.
If the hysteresis were set to 2 °C, the alarm would only turn off when the temperature dropped down to 21 °C, decreasing the amount of emails you would recive.