Lesson 1.2 Device Views
Views are found in the Device menu and are used to visualize sensor data using customizable columns and settings. They are highly flexible and can include graphical elements, color coding, and filters — for example, to help identify anomalies. Once created views can be shared within an organisation or exported as a text string.
Views are quick to set up and useful for many purposes, such as:
- Device supervision (e.g. report intervals)
- Alarm monitoring
- Temperature tracking
- Energy and water consumption
- Seat occupancy
- Asset tracking
- ...and more
This lesson begins with a step-by-step guide to setting up a temperature view. It then continues with how to add filtering and a refresh timer to detect anomalies, followed by an explanation of the Group By feature and time management options. Finally, it introduces the Missing Expected Report feature from a view perspective. After the temperature view section, you’ll find additional examples on how to set up and configure other types of views.
Temperature View
Let’s set up a temperature monitoring view with color-coded values for easier visual tracking, and filter out devices that don’t match your criteria.
-
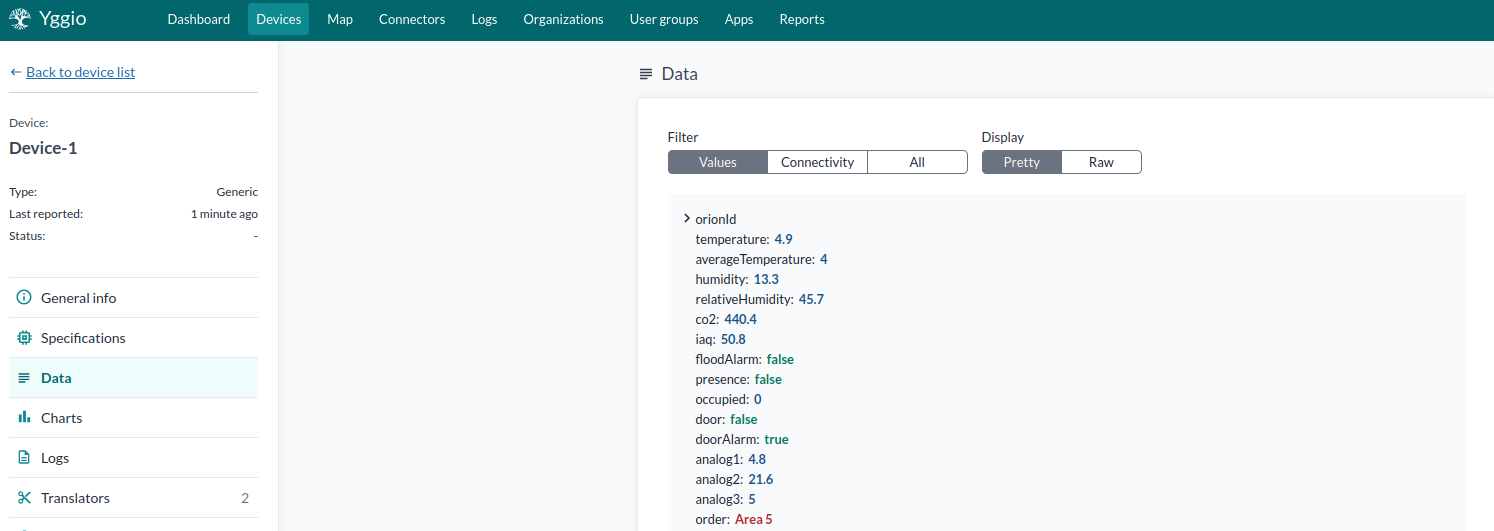
Open the Data tab of any device.
Copy the key for the value you want to monitor—for example:temperature.Note: Property keys are case-sensitive.
-
Exit the device view.
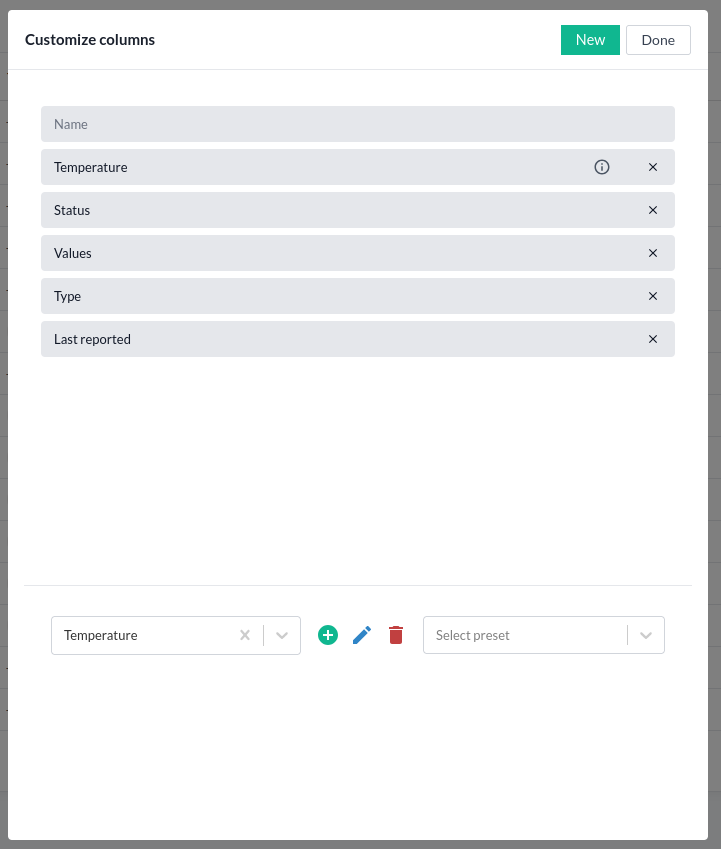
In the device list view, click Customize Columns, then click New to create a column. -
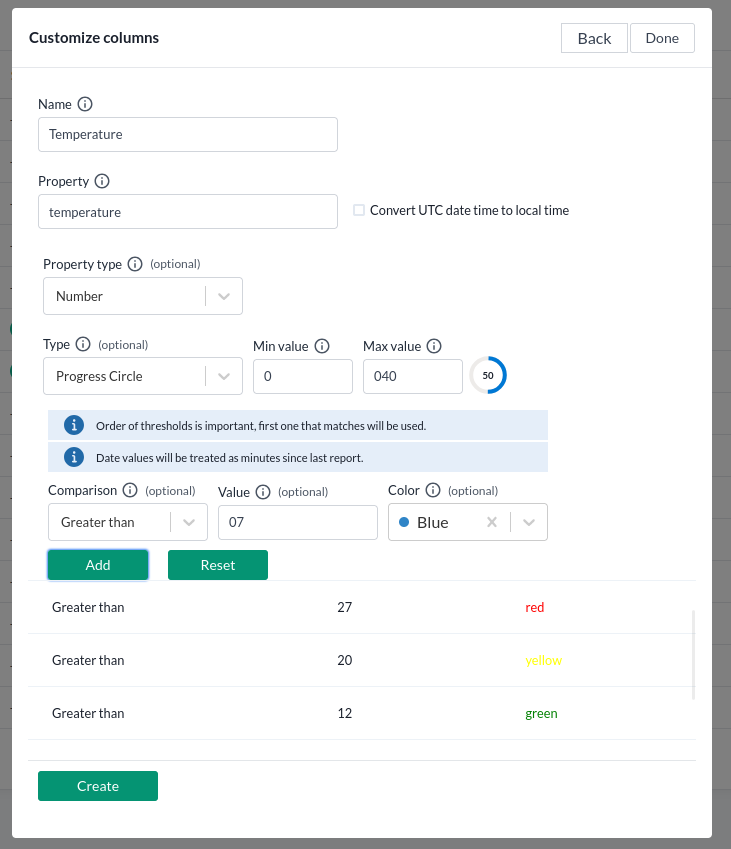
Configure the column using the parameters below, then click Create.
| Field | Description |
|---|---|
| Name | The header shown in your column. |
| Property | The device property to display (e.g., temperature). |
| Convert UTC to local time | Converts UTC datetime to local time. Only works with date fields like reportedAt. |
| Property type | Choose either Number or Boolean. |
| Type | Display format: Default (text)Progress bar, or Progress circle. Require min and max values. |
| Comparison | Add color rules based on values. Only the first matching rule is applied. |
-
Add the column to your view:
Use the field in the bottom-left corner to search for the name of the column you just created.- Click the green plus (+) to add it.
- Click the blue pen to edit.
- Click the red bin to remove.
- Use the small crosses next to added columns to remove them from the view.
-
Click Done to finish the customization.
-
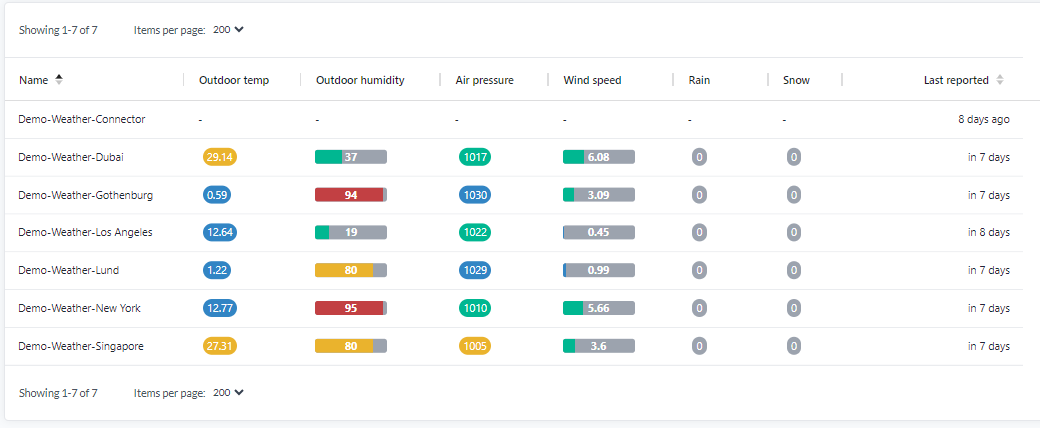
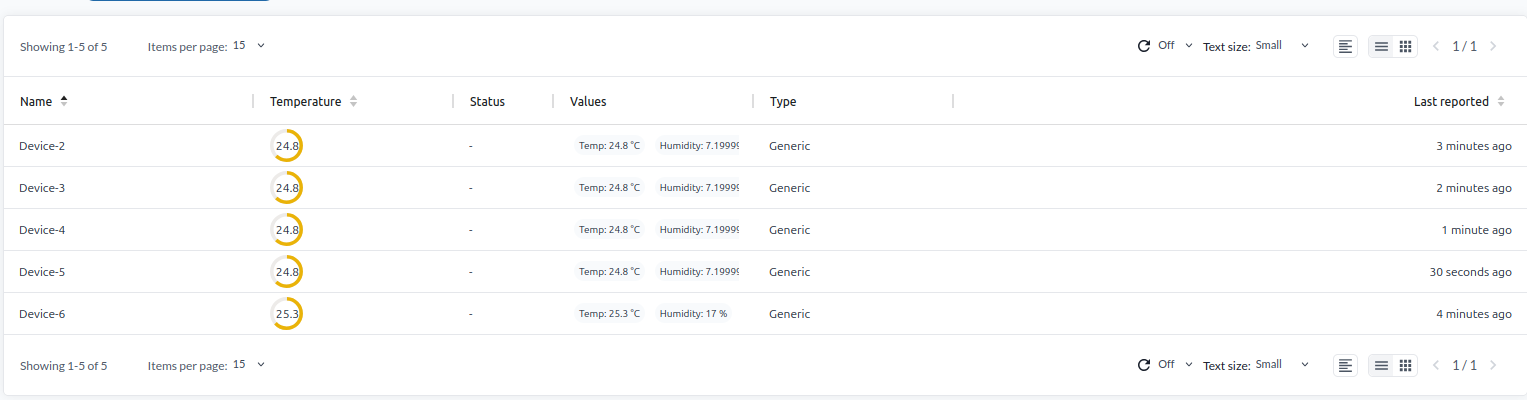
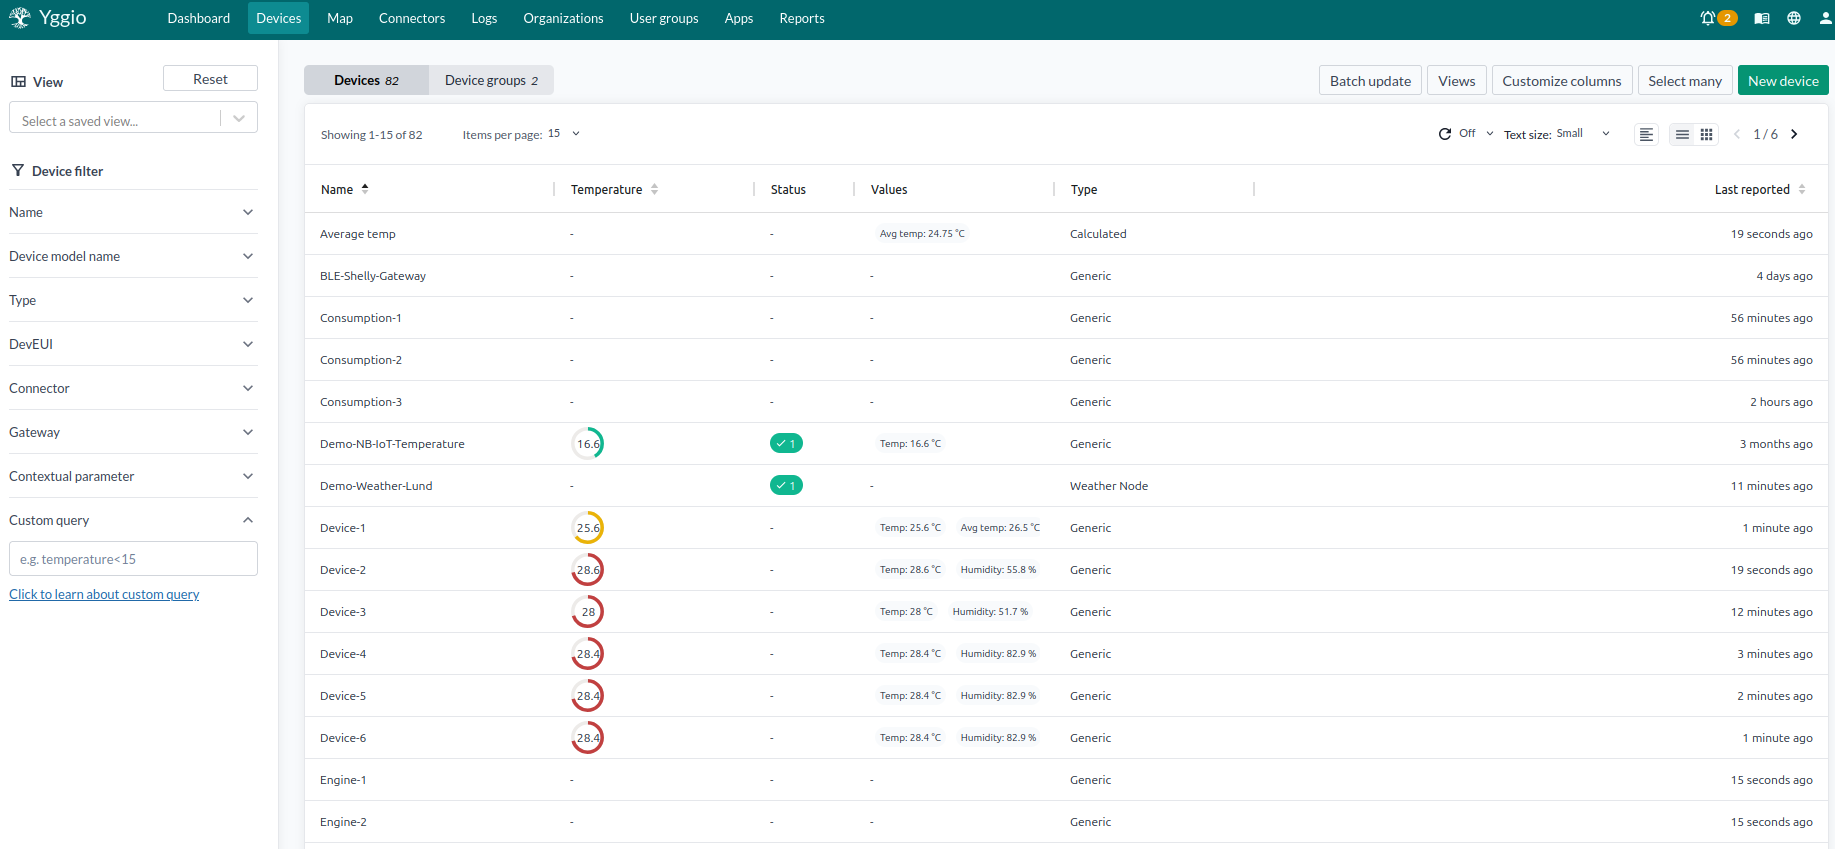
Your device list should now include the temperature column.
If some devices don’t have this property, they’ll show up with empty values.To filter them out, use the Custom Query field on the left:
Typetemperatureto only show devices that include this property.You can also apply other filters using the options in the left panel.
-
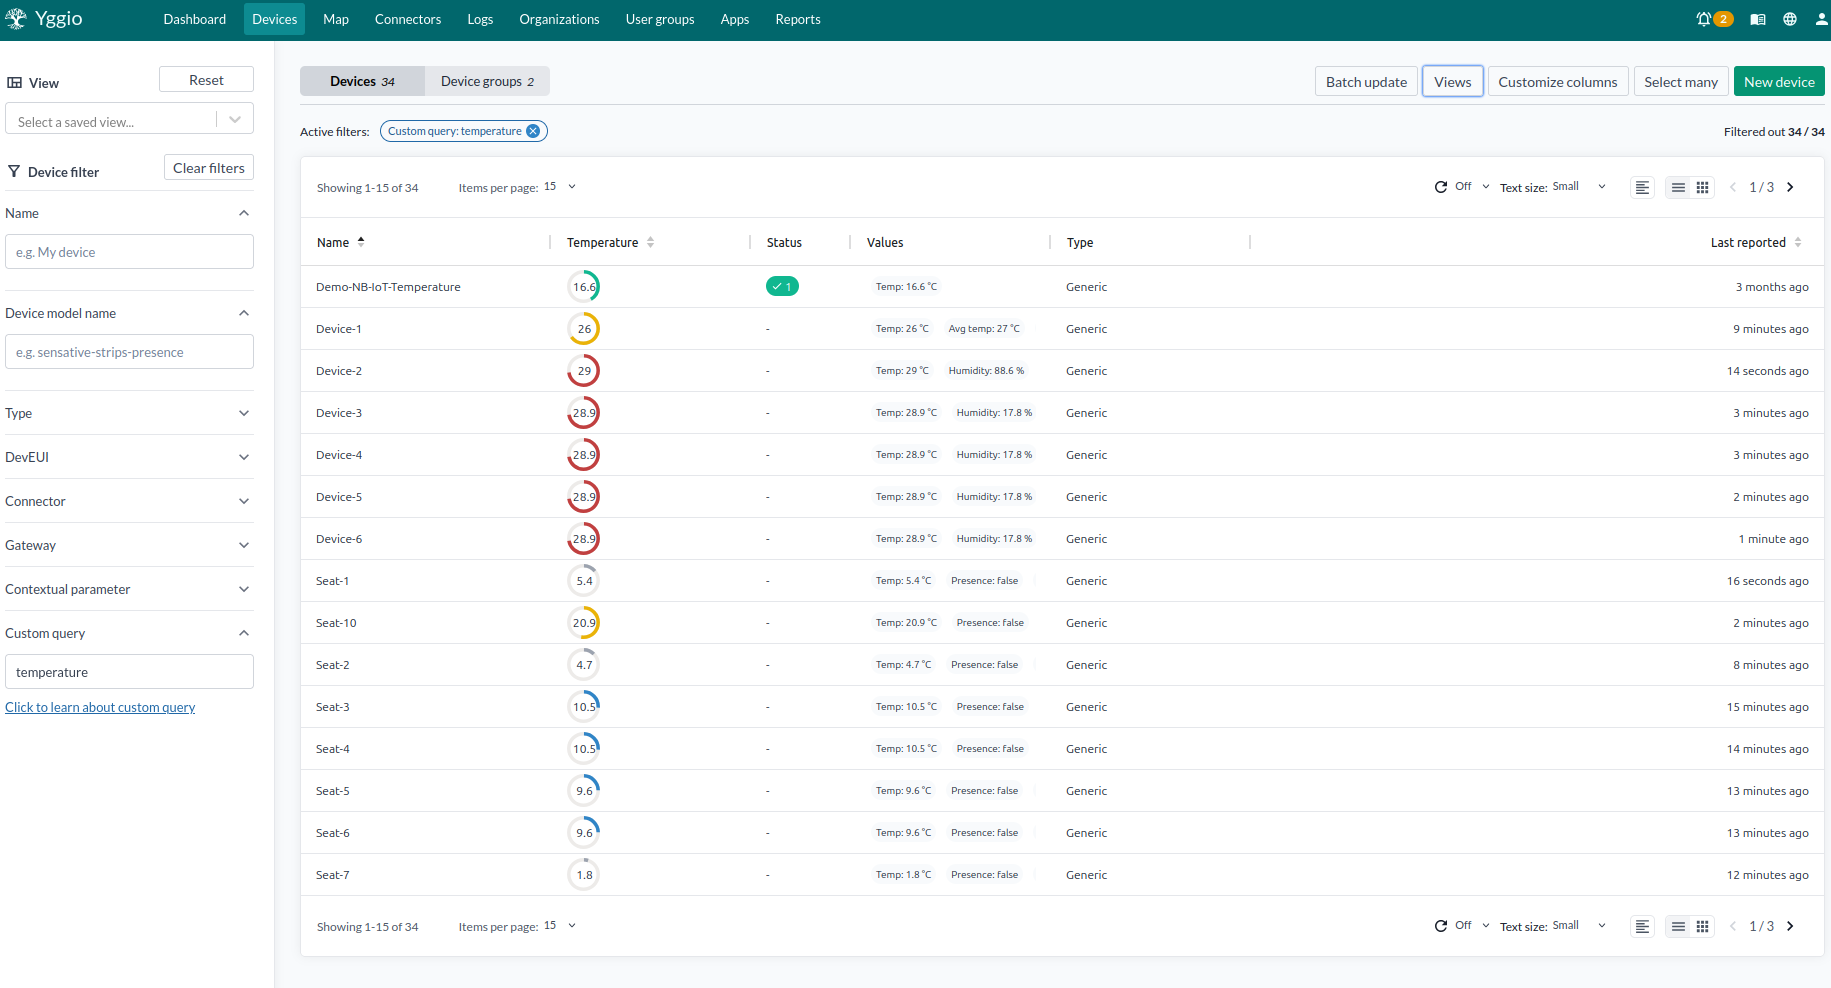
If you have many devices, you’re probably not interested in all of them—just the ones showing abnormal values.
To focus on those, update the Custom Query field on the left to:
temperature>23This will only show sensors where the temperature is above 23.
You can combine this with other filters to narrow down the view to exactly what matters.
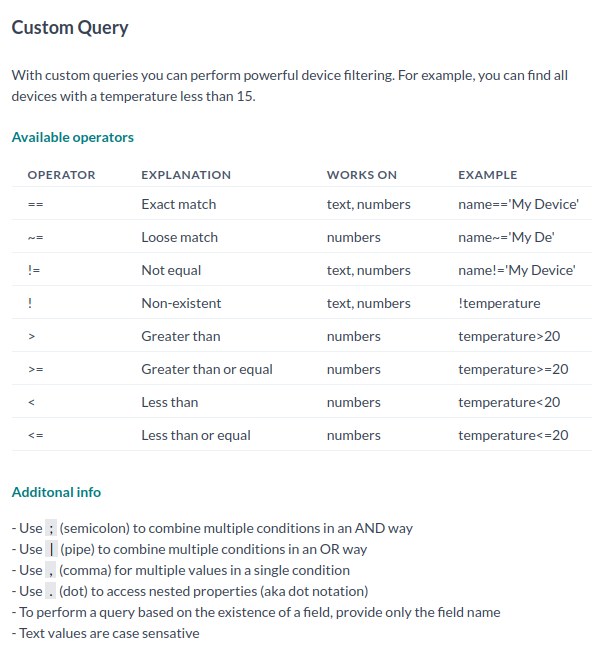
The query language is based on the FIWARE Q query format.
You can use a variety of operators to combine conditions and filter devices more precisely.
To filter on nested properties, use a dot (.) as the level separator.
- Let’s update the filters to try combining multiple conditions.
(Reminder: all keys are case-sensitive!)
| Filter | Value | Description |
|---|---|---|
| Name | evice | Filters ut all IoT nodes who name include "evice" somewhere (loose match) |
| Device Model Name | strips | Filters ut all IoT nodes that includes strips somewhere in their Device Model Name (loose match) |
| Name & Custom Query | Name: StripsCustom Query: temperature>23 | Find all devices whose name inlcude "Strips" (loose match) and with temperature > 23 (exact match) |
| Contextual Parameter | Key: Location | Find all devices whose contextual parameters has a Key called Location (exact match) |
| Contextual Parameter | Key: LocationValue: Building 1 | Find all devices whose contextual parameters has a Key called Location (exact match) with Value Building 1 (exact match) |
| Custom Query | temperature>23|temperature<20 | Find all devices whose temperature is more than 23 OR less than 20 (exact match) |
| Custom Query | temperature>23;relativeHumidity>80 | Find all devices whose temperature is more than 23 AND with a humidity above 80% (exact match) |
| Custom Query | output.temp>23 | Find all devices who has a nested parameter output with a key temp more than 23 (exact match) |
All filters are AND condition on top of each other. The more that are specified the moe one narrow down ones search criteria. Only way to use OR is to use Custom Query text box.
When you're satisfied with the setup, click Views in the top-right corner.
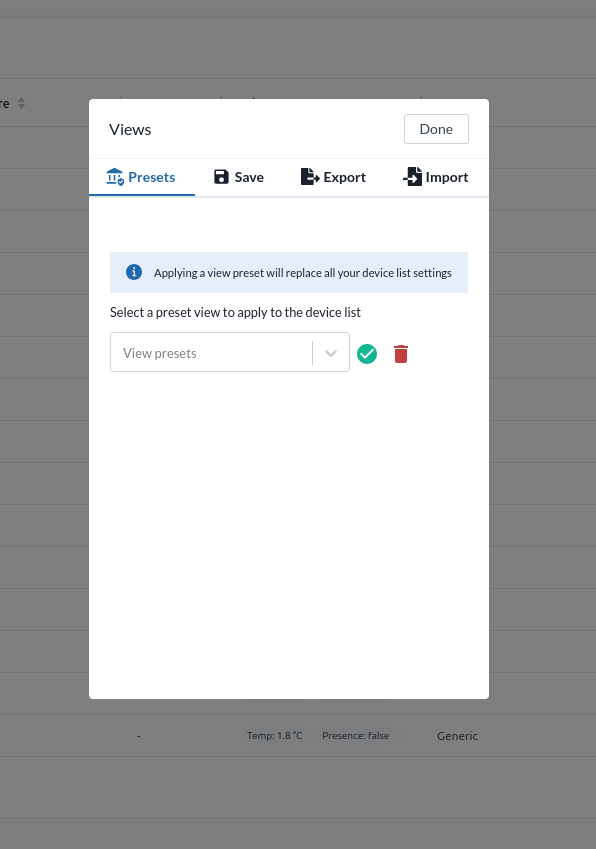
- In the View menu, select Save tab.
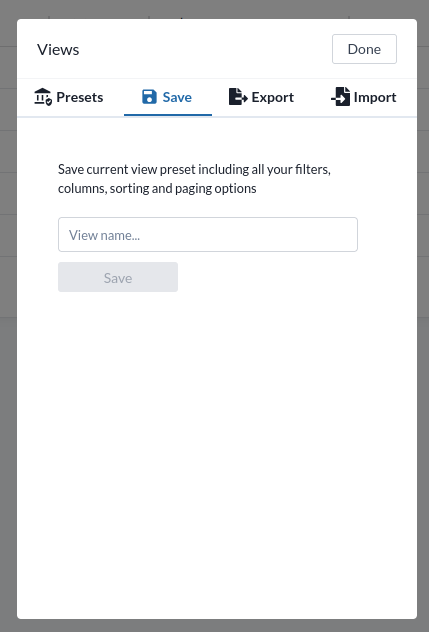
- Enter a name for your view and click Save again.
You can now switch to this view anytime using the dropdown in the top-left corner.
You’ve now created and saved your first custom device view!
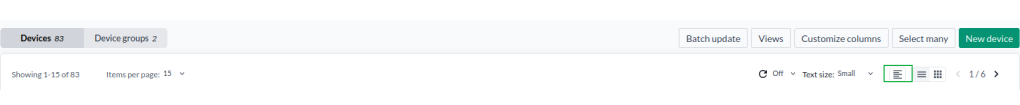
Refresh Timer
By default, only devices present when the view loads are shown, and sorting is performed only once at load time. If new devices later match the view’s filters or if the sorting order changes, they won’t appear or update unless the view is refreshed—sorting won’t update automatically either.
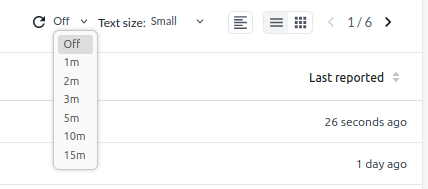
To avoid this, use a commonly overlooked feature: the Refresh Timer. It can be triggered manually or set to update automatically.
Click the timer icon on the right side of the device navigation bar and set an update interval. This ensures your view stays updated with all devices that match its filters — including newly added ones — and maintains the correct sorting order.
Group by
You can group devices in device views using the order property.
This feature allows you to organize devices into groups.
To use the Group by function, you first need to configure the groups.
-
Select the devices you want to group.
- For example, to select all devices in a building, use the Contextual Parameter filter to show only those devices.
- Use the Select Many button found at the top-right corner of the Devices menu.
-
Choose Edit as the action.
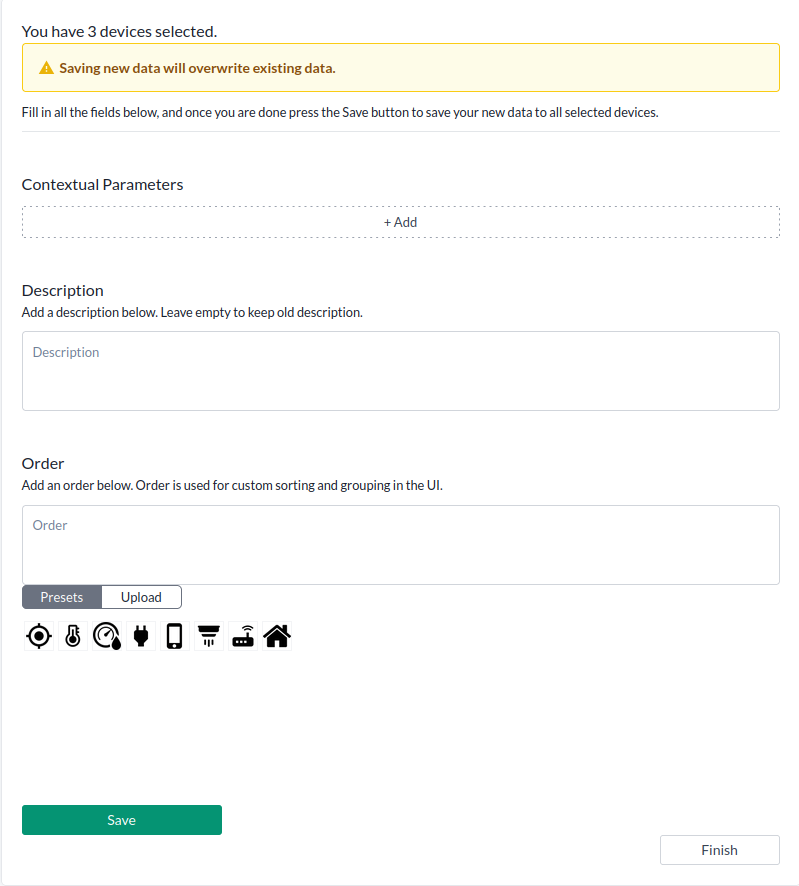
- In the text box for
Order, add a group name and press Save and then Finish.- You will need to repeat this for multiple groups and give them each a unique name.
- To verify it worked, check the
ordervalue in the device’s Data tab; the key should match the group name.
-
To activate grouping, press the marked Group by button in the device view.
-
You can now customize and create a view using this grouping.
When finished, save the view.
Time Visualization Within the View
You can customize how a UTC (Coordinated Universal Time) timestamp is displayed in a view. For example, consider the reportedAt field, which updates whenever a device sends a new uplink. This timestamp can be shown either as elapsed time (e.g., 10 seconds ago, a minute ago, etc) or as a local timestamp based on your browser’s time zone and formatting. Additionally, you can apply color coding based on how long ago the timestamp occurred.
To set this up:
- Go to Devices → Views → Customize Columns → New.
- For the property, enter
reportedAt. - Leave the checkbox Convert UTC date time to local time unchecked to display elapsed time.
- In the color coding section, add the rules in this order (important: conditions are evaluated top to bottom):
- If less than 2 minutes → green
- If less than 3 minutes → yellow
- If more than 2 minutes → red
Note: Use "more than 2 minutes" instead of "more than 3" — since conditions are evaluated in order, anything not matching the first two will fall through to this rule.
Click Save on your new column, add it to a view, and observe the result once a device reports.
Repeat the exercise, but this time check the Convert UTC date time to local time box. The color coding will behave the same, but timestamps will display in your local time zone and format instead of elapsed time.
Since you can sort by reportedAt, this becomes a valuable feature when you have an operational target—such as ensuring that a device reports within a certain time frame. By combining time-based color coding with the Refresh Timer, you can create a view that automatically brings devices that haven't reported recently to the top of the list and apply suitable color coding for highlighting.
Missing Expected Report
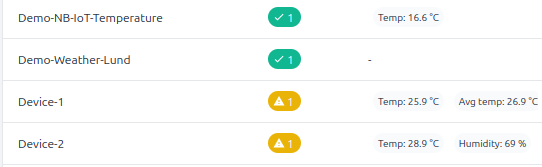
Missing Expected Report helps you monitor devices to ensure they report within their set intervals. If a device fails to report on time, you receive a high-priority log indicating the issue. The device's status field changes color based on general status of device which includes signal strength and reporting interval. If status field is green:
- Green: All is ok including Device reported on time
- Yellow: Device missed its report interval or some other warning, if device missed its report interval this will create an alarm log event that requires acknowledgment.
To set it up:
-
Go to Devices → [select device] → Report Interval.
Click Edit, set the desired report interval for the device, and click Set.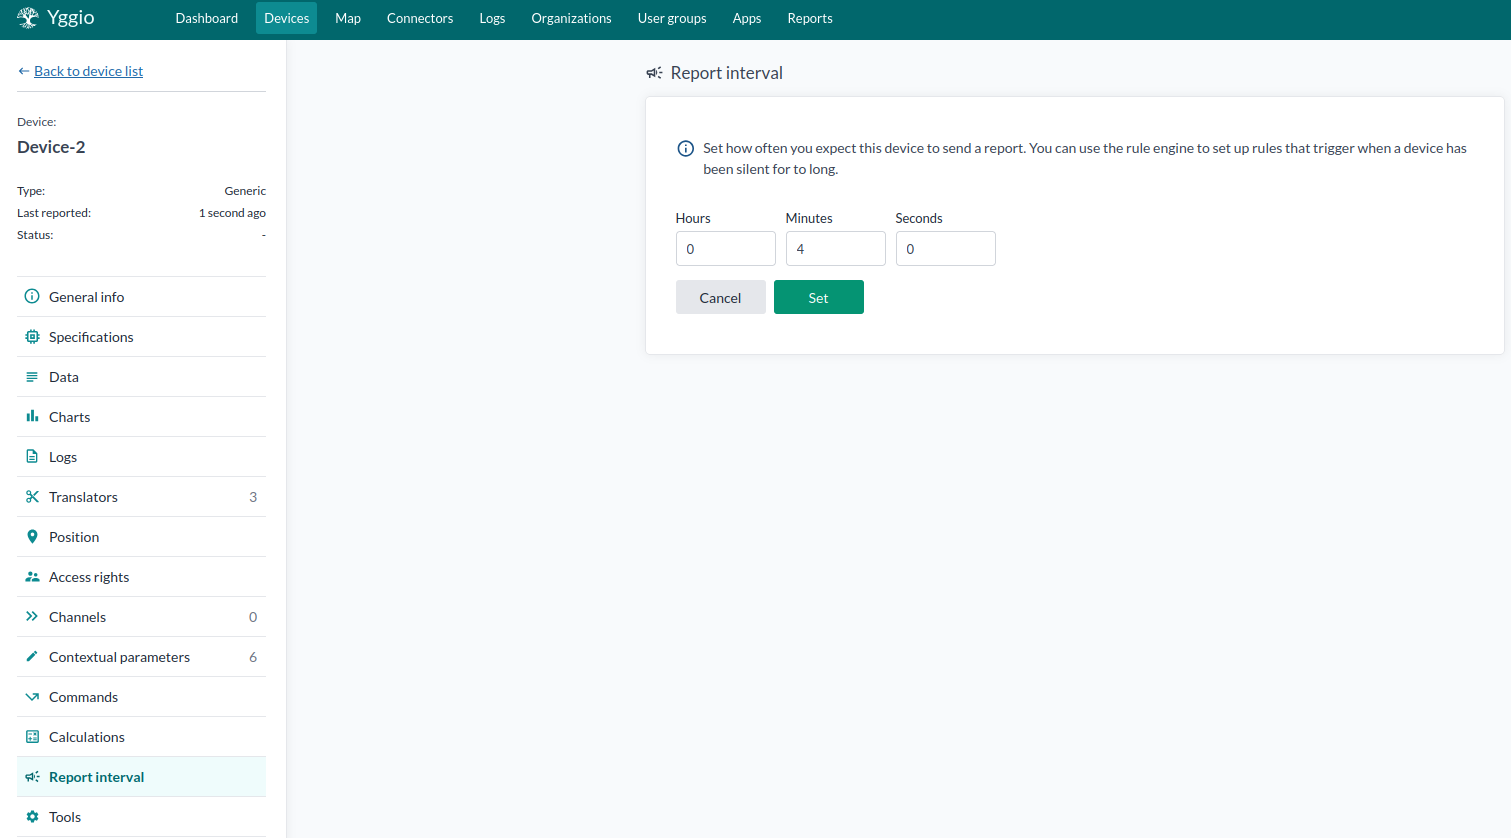
-
When an alarm triggers, the status will look like this:
-
After a report interval alarm is triggered, you must acknowledge it in the Logs (navigation bar).
Without acknowledgment, the alarm won’t fire again to prevent spamming.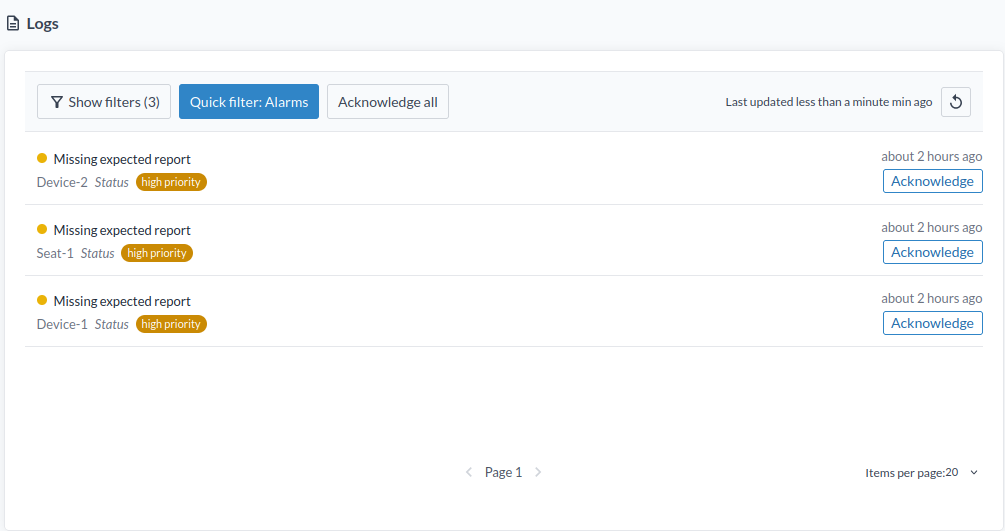
Reminder: As mentioned in bullet 3 above, the "Missing Expected Report" event requires acknowledgment. It won’t trigger again until acknowledged. This prevents repeated notifications from spamming end users.
Example views
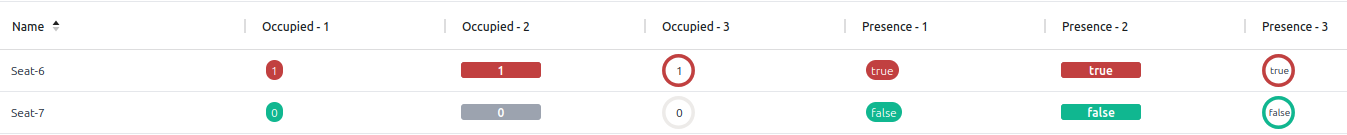
Seat Monitor View
You can use views to monitor seat occupancy using either:
occupiedvalues (0or1)presencevalues (trueorfalse)
This helps track which seats are in use and when. The process is straightforward:
-
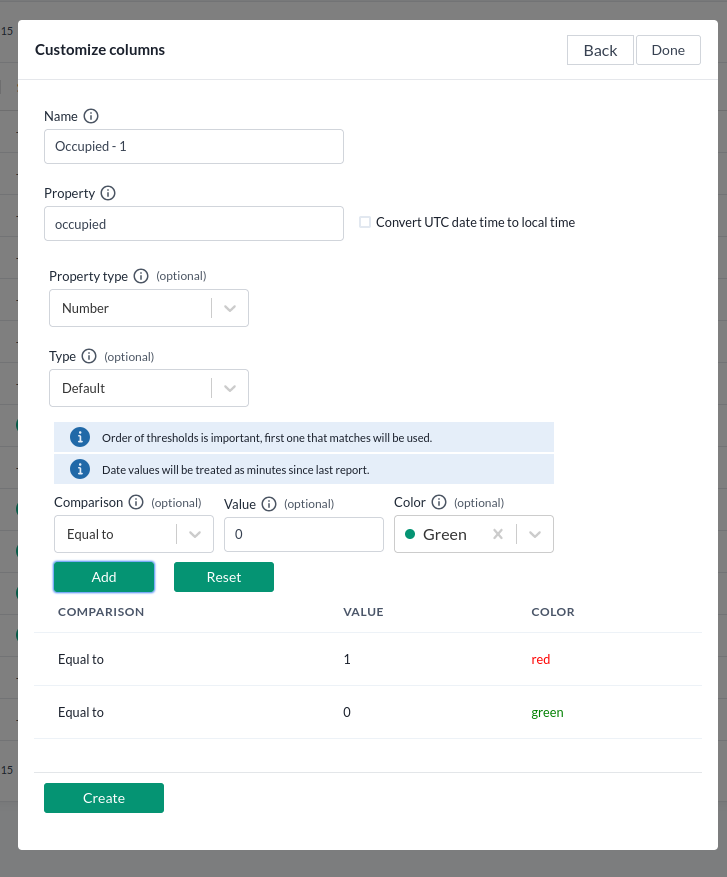
Go to Devices → Views → Customize Columns → New.
-
Choose the setup that matches your data and preferences.
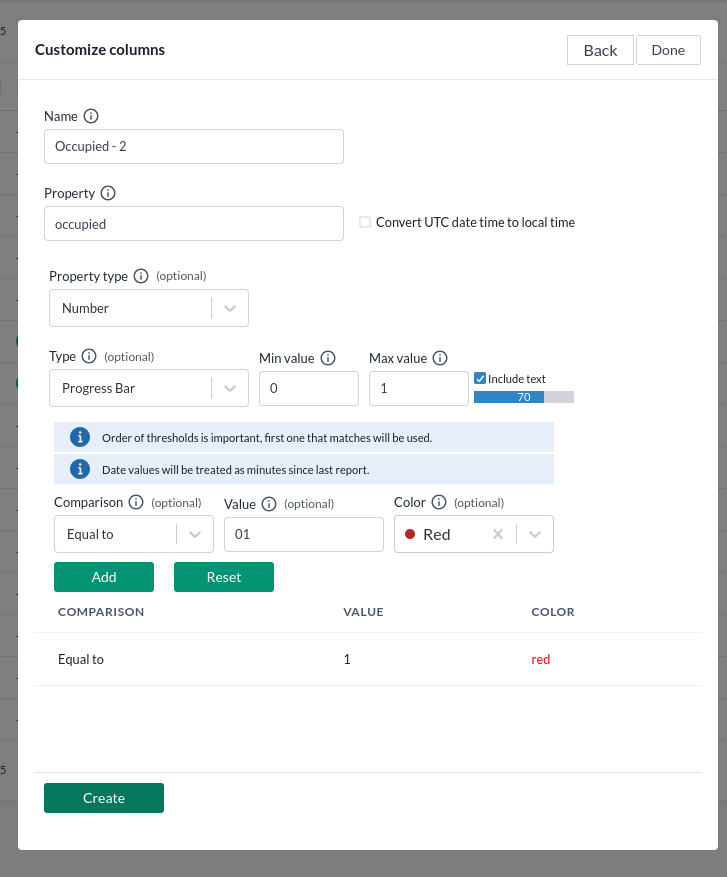
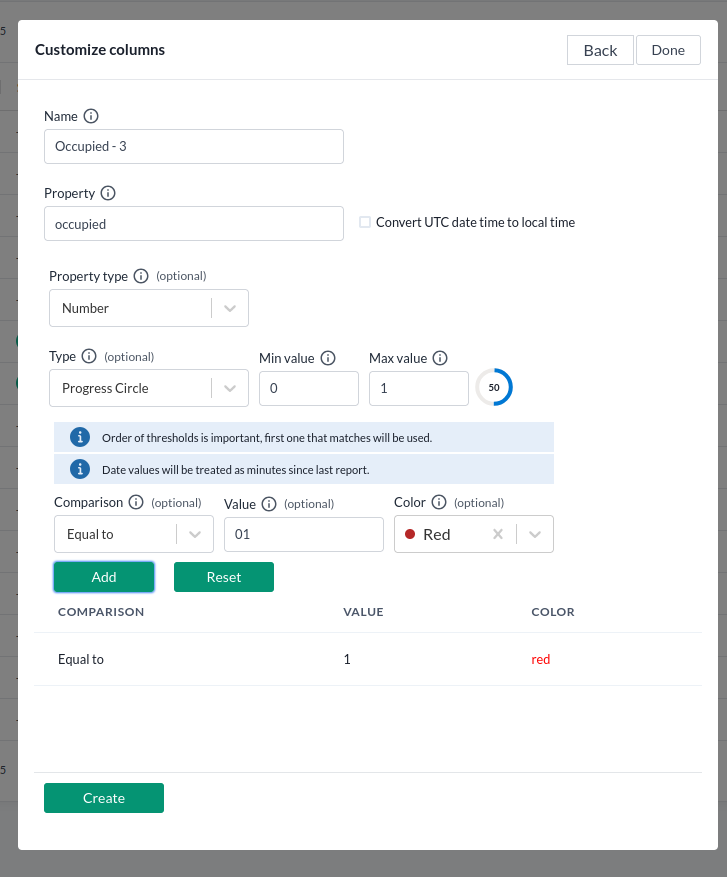
The screenshots below show different ways to configure the column—pick the one that works best for your use case.Occupied (0/1):
Occupied 1
Occupied 2
Occupied 3
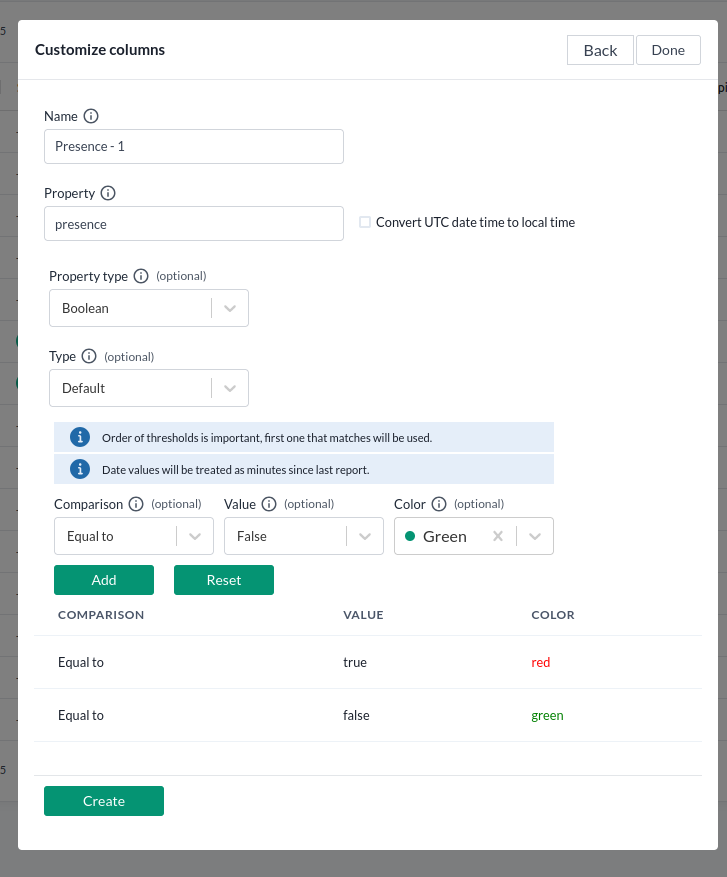
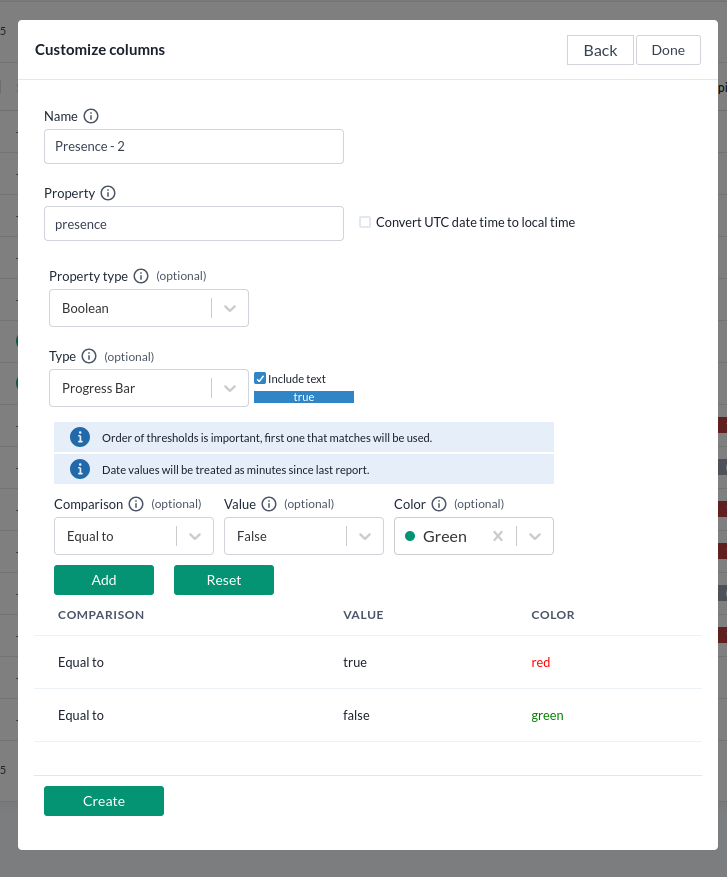
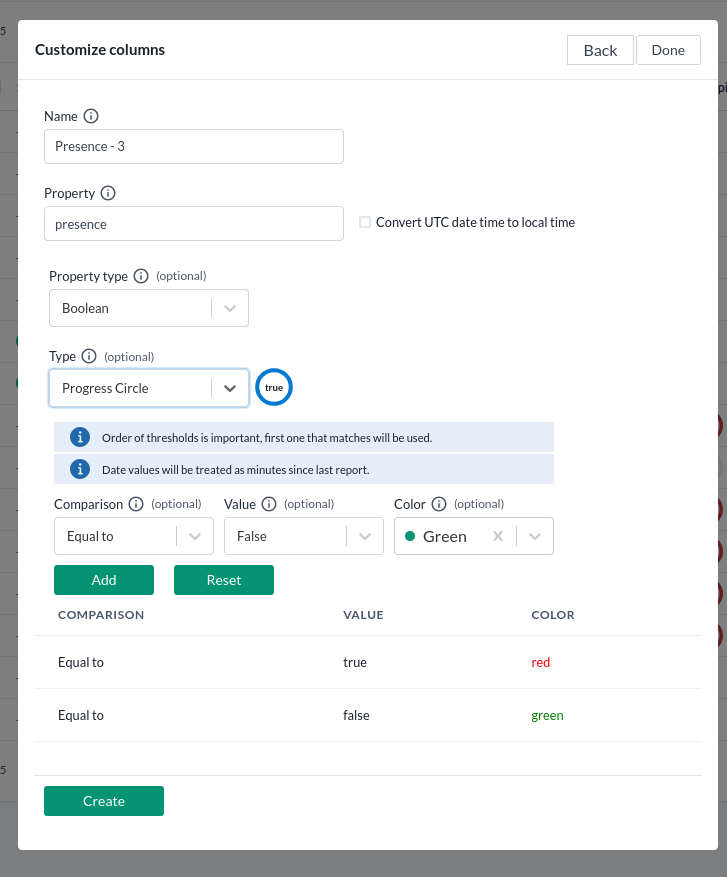
Presence (true/false):
Presence 1
Presence 2
Presence 3
-
Customize the column settings as needed—such as color rules, display format, and column name.
When you're happy with it, add the column to your view and click Done.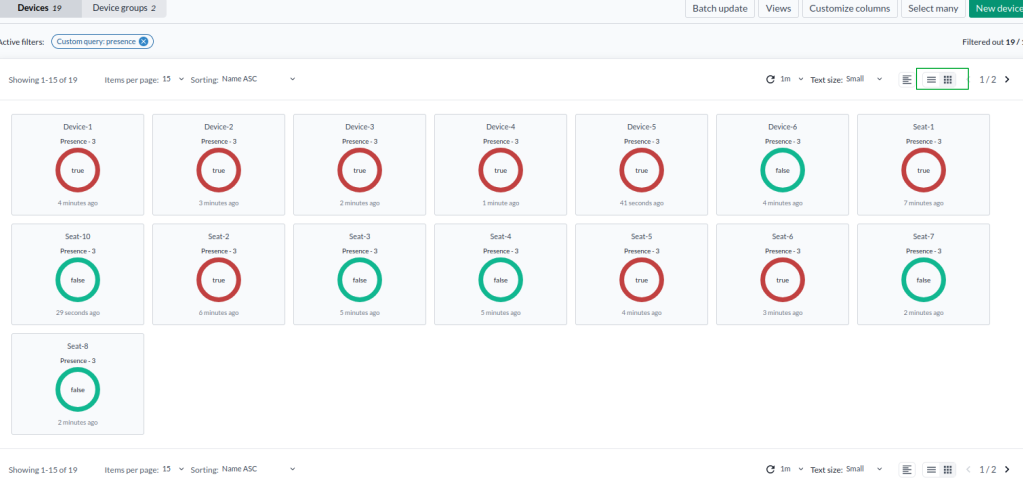
You can also switch to a grid layout if that suits your use case better.
Look for the green-highlighted grid buttons in the Device menu -
Don’t forget to save your view—just like you did in the previous section.
Click Save, enter a name, and confirm. You can now switch to this view anytime.