Lesson 1 Standard Work flow
This is a step-by-step guide covering the most common activities when setting up your IoT solution on the platform. It is intended for users with full access rights to all features in the platform. The steps are presented in a natural, logical order—each with a short introduction, followed by more detailed information in the training material, user guide, and developer documentation.
![]()
The basics – Understanding Connectors
Connectors are essential building blocks that bring external data into the platform. They store the necessary credentials, endpoints, and topics that allow the IoT platform to subscribe to data streams from remote systems. Setting up a connector typically requires access to the external system, along with the correct credentials and permissions. Since each system is different, some understanding of how the source platform works is usually required.
What Are Connectors Used For?
Connectors are used to integrate the IoT platform with various data sources, such as:
- Public services (e.g., OpenWeatherMap)
- LoRaWAN network servers
- Devices using protocols like MQTT, HTTP, NB-IoT, Cat M, BACnet, Modbus, and others
New to the Platform?
If you're new to the platform, you likely already have at least one connector configured, and some devices may already be shared with you by your IoT administrator.
- If you need to add your own devices, continue to Step 1 – Adding Devices.
- If not, you can skip ahead to Step 3 – Visualization - Device List Views to start working with the data.
Step 1 - Adding devices
When you have at least one connctor it is time to add devices. Once devices are added you can monitor them with views. So let's get started
Adding IoT nodes
Adding IoT nodes to the IoT platform is the foundation. There are three main types of IoT nodes:
- Devices: Represent a physical device, normally a sensor or an actuator. Devices usually requires that you add a device type unique "translator" to decode incoming compressed data.
- Virtual Node: A logical node used in data flow to hold some type of state or indirectly represent a physical device — such as a geofence, a WiFi beacon, a calculated node, or a simulated device.
- Services: Data coming from external services like OpenWeatherMap or Nordpool (energy price data).

It is recommended to start by adding LoRaWAN IoT devices, as LoRaWAN is currently the most widely deployed LPWAN protocol. It is also the most open and standardized in terms of operation, which makes integration and management simpler.
Once a device has been added, it may need to be configured to report data at the desired time interval. For LoRaWAN devices, this can be done directly by navigating to LoRaWAN Control and sending a configuration downlink. Alternatively, multiple devices can be configured at once using Select Many → Configure.
Learn More
- Training material for New LoRaWAN Devices
- User guide for New Devices
Step 2 - Visualization - Device List Views
Understanding Views
Views let you display device data in a structured, customizable table using visual elements like color indicators, progress bars, and circular gauges. You can also include interactive components—such as command buttons—to control actuators directly from the view.
Devices can be grouped and arranged freely using drag-and-drop, and columns can be fully customized to show exactly the data you need. To control which devices appear in a view, use Q query filters. For example, entering temperature > 23 in the Custom Query box filters out devices below that threshold—helpful when identifying overheating rooms or energy inefficiencies.
Device values update in real time, but filters are only applied when you click the Refresh button in the top-right corner of the device list. To automate this, set a Refresh Timer to periodically update filters and keep your view current.
Once you're happy with the setup, you can save the view and share it with others—either directly or through the Organisation Manager.
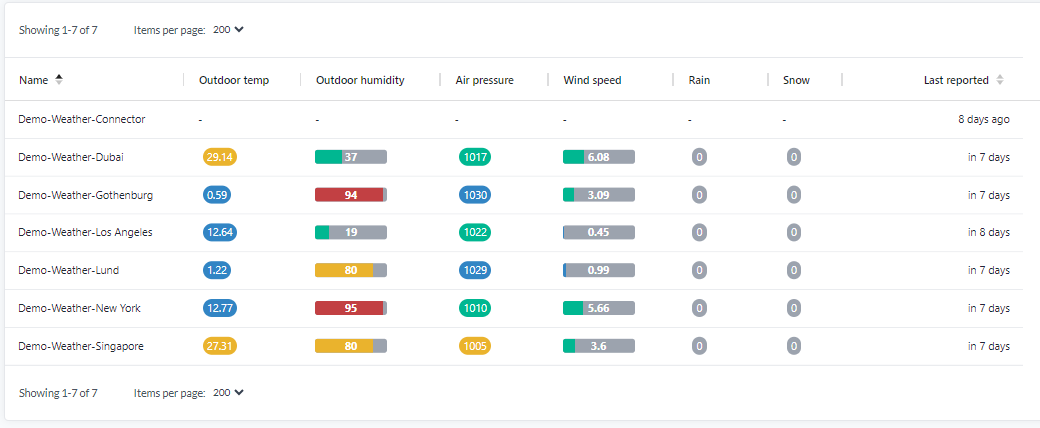
Use color coding and thresholds to highlight important values. Choose from several graphical components, including progress bars and circles. Time-based color coding is also supported.
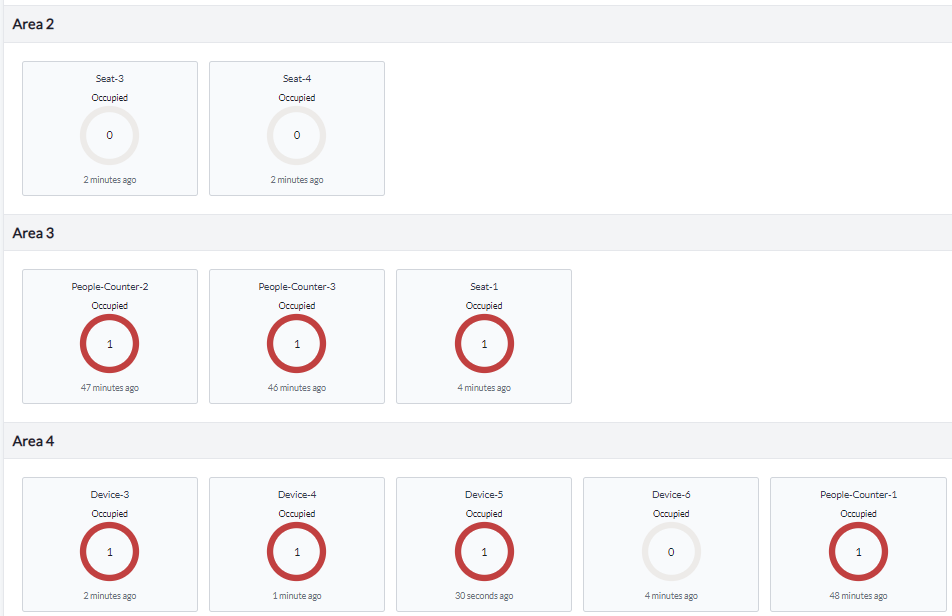
Use the “Group By” feature to organize devices into logical sections. This helps simplify large lists and makes patterns easier to spot.
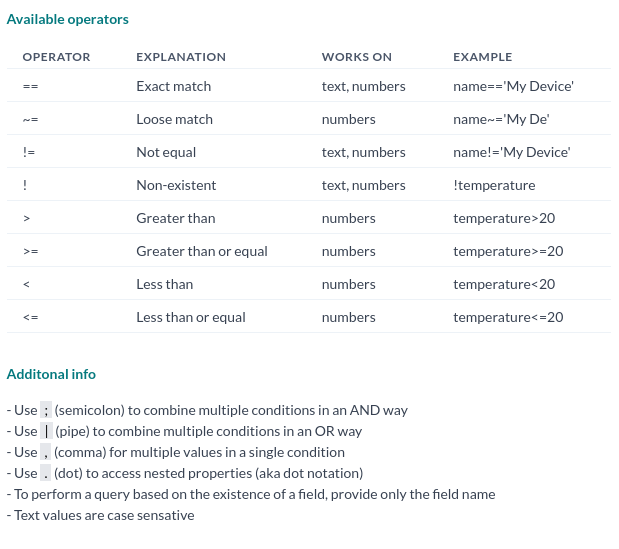
Use powerful FIWARE Q Query syntax to filter devices. This is useful for searching for anomalies or locating devices with specific values like a particular address or building.
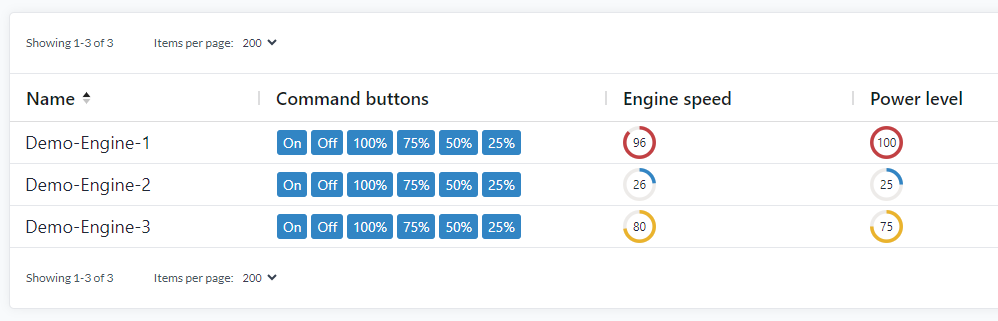
Control actuators directly with command buttons integrated into the view.
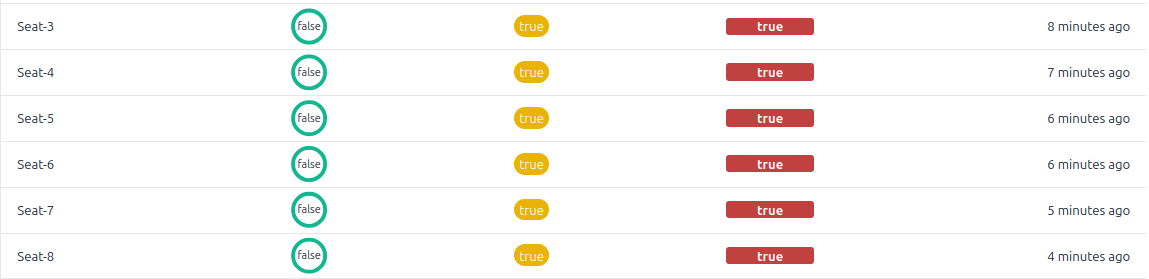
Example of a custom alarm monitoring view that highlights when values are too high or too low—so you don’t have to check data manually.
Learn More
- Training material for views
- User guide for Device Views
- User guide for Device List
Step 3 - Add thresholds and alarms to supervise devices
Alarm translator
Alarm translators are useful for getting alarm data directly on the Data tab in the device, and can be used to create views in the case of a threshold breach. This is logic that monitors incoming data for threshold breaches and greatly simplifies managing thresholds and alarm levels. A translator can be a hardware decoder or any arbitrary code that calculates, joins, or splits data between real or virtual devices. It can range from simple monitoring to advanced logic.
General timer is a special translator that together with the general timer Flow makes it possible to delay an alarm if the trigger value is x for y amount of time.
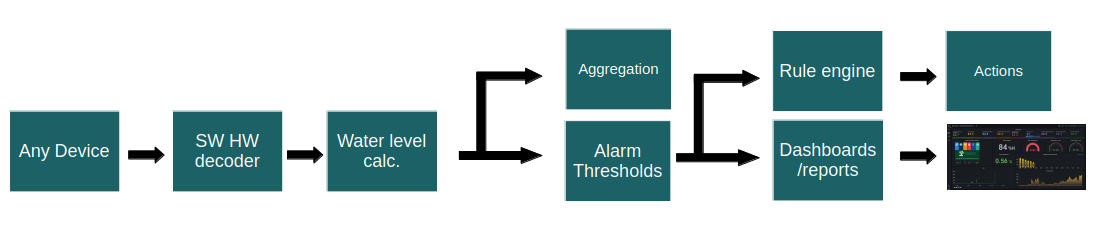 An example of a flow to calculate the liquid volume in a horizontal tank and set alarm thresholds with visualizations
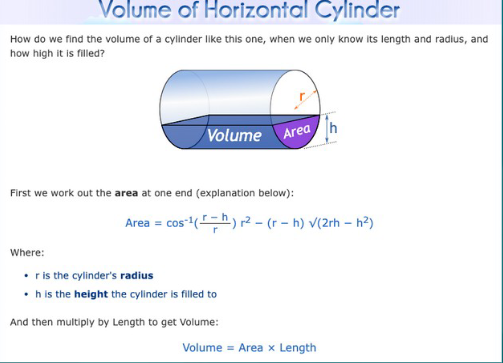
The formula to calculate volume in a horizontal tank implemented in a translator
Learn More
- User guide for Custom alarm translators
- Training material for Alarm views and translators which allows you to for example monitor temperature, mold risk, seat occupancy, etc.
Step 4 - Scale up, use Batch Manegement
Want to scale without repeating the same steps over and over? Batch Management is the key.
There are two main ways to perform actions in batch:
-
Select Many
Use this feature to execute batch operations on IoT Nodes—edit them, configure them, change translators, and much more.
In the following lessons, Select Many will be used extensively. -
Export and Import via CSV
Export your devices to a CSV file, modify it, and re-import it.
This allows you to rename multiple devices, add or update values, or edit contextual parameters—all through a simple CSV file.
It’s a fast and efficient way to perform bulk updates without editing each device manually.
Exporting to CSV is also the easiest way to extract data from the platform.
Learn More
- Training Material CSV File
- User guide Select Many
- User guide Batch Update
Step 5 - Visualization - The map
For a device to appear on the map, it must have a valid position using WGS84 coordinates (Latitude and Longitude). If your device doesn't have a position set, navigate to:
Device List → [Your Device] → Position
There, you can manually place the device at its correct physical location. Once the device appears on the map, you can also reposition it directly by dragging it to the desired location.
![]()
Trackers moving around live on a map view
Map and map views
Map views are used to visualize data geographically. They function similarly to the device list, but instead of displaying data in a table, devices are shown based on their physical location. You can apply color coding to device icons and display values directly on the map. It’s also possible to show geofences along with the number of assets inside, using the general geo query flow together with generic IoT nodes that contain asset details. Map views are useful for quickly identifying relevant devices and data in a spatial context within the Devices section.
Map views are also reused in the Map widget, allowing you to quickly build dashboards with geographical insights.
Learn More
Step 6 - Visualization - Dashboards
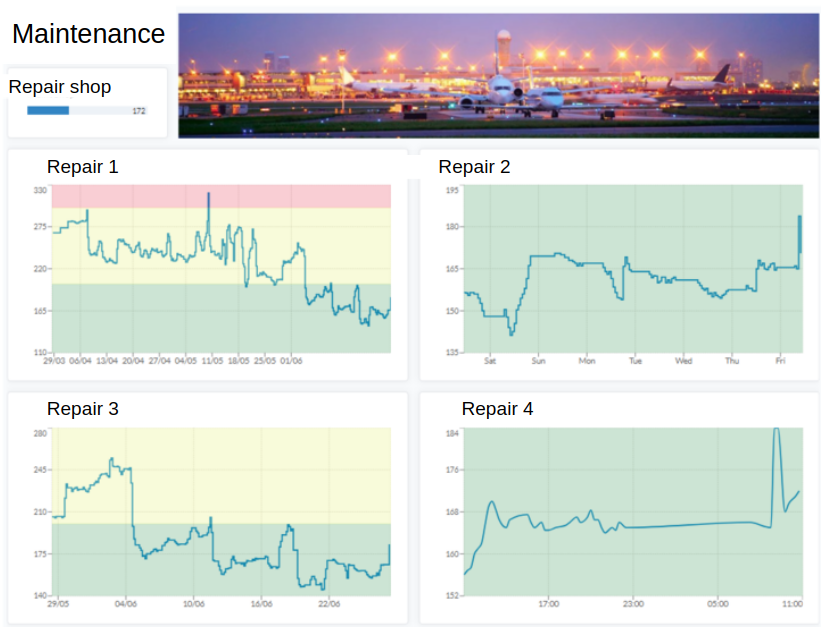
Dashboards are built using drag-and-drop widgets. The available widget types let you customize your dashboard to fit your needs—so let’s get started with creating the dashboard you'll see when you log in. Below is an example dashboard for inspiration.
Available Widgets:
| Widget Template | Description |
|---|---|
| Device Value | Displays a device's value as a number, circle, bar, or gauge. |
| Resource Count | Shows the number of devices, locations, organizations, apps, or rules. |
| Device Chart | Displays a device's time series data in a chart. |
| Logs | Shows the latest logs from your devices. |
| Text | Displays custom text. |
| Map | Shows the location of your devices on a map or a geotagged image. |
| Image | Displays an image. |
| Floorplan Widget | Shows a floor plan and allows you to add IoT nodes to display device values. |
- User guide dashboard documentation: Dashboards
- Training material Visualize your data with dashboards
Step 7 - The location manager, visualization level 4
The Location Manager is designed to visualize locations, typically buildings.
There are two variants of the Location Manager:
-
Location Manager
This version allows users to create personal locations using blueprints with overlay icons.
It is planned to deprecated during 2026 but will remain as the legacy Location Manager for the forseeable future. -
Floor Plan Widget
Introduced in version v3.34, the Floor Plan Widget in the Dashboards includes all functionality of the legacy Location Manager — and much more.
In this new model, a Location will be redefined as a collection of dashboards associated with a specific geographical area.
These dashboards will be able to get customized to visualize and share all data relevant to that location.
Learn More
- User guide Location Manager
Step 8 - Access Rights and Data sharing
Users in the platform can share resources in three ways:
- Direct user-to-user sharing – Share specific resources with individual users.
- User group sharing – Share resources with a group of users at once.
- Through the Organization Manager – Set up a hierarchy and apply sharing policies accordingly.
User groups are especially useful for managing permissions across multiple users efficiently. You can easily change access rights for a user or user group—for example, directly through the Device menu.
Access Rights
When sharing a device, you assign the receiver specific access rights that control what they can do:
- Read: View data only
- Write: Modify device settings and data
- Admin: Full control including sharing and managing access
- Peek: System-level read access, not visible in the UI
- Owner: Full rights with the ability to transfer ownership
Access rights granted to a user group apply to all members, and user groups themselves can also be shared.
Shareable Resources
- Basic Credential Sets
- Connectors
- Dashboards
- Device groups
- Geofences
- Images
- IoT nodes
- Reports
- User groups
You can direct share resources either while viewing the resource or through Devices → Select Many.
Note: Views in the Device List and Map are not considered shareable resources. They follow a simpler sharing model, as they are seen as personal adaptations.
Views are either personal or shared with the entire organization. If shared, only an organization admin can modify or remove them.
Learn More
- User guide Direct Sharing and User Groups: Access Rights
- Training material Direct Data Sharing
Step 9 - Add Notifications Through the Rule Engine
Rules
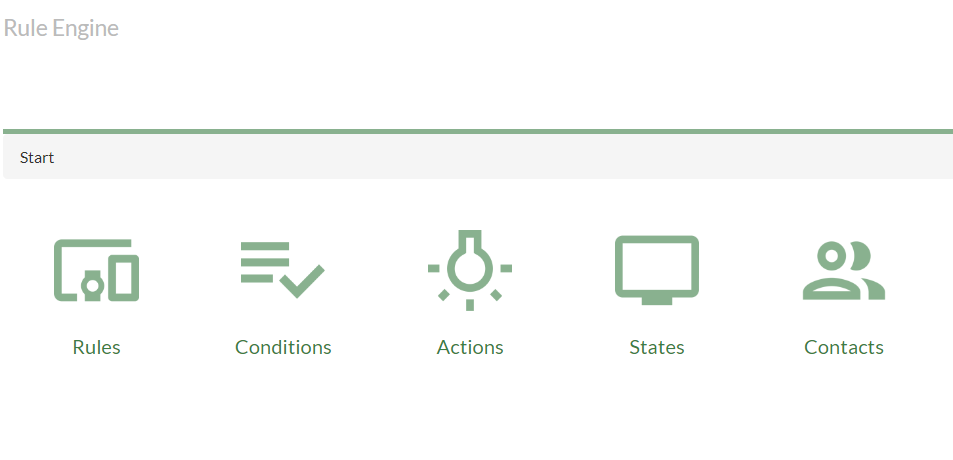
Rules are triggered by pre-defined or custom conditions. A common use is to check thresholds or verify that devices are reporting as expected. This is typically done to send notifications when something important happens.
Let’s start with threshold supervision. For example, you might want an email notification when it’s 25°C outside so you know it’s time to go out, or an alert when a moving device leaves a geofenced area. In the previous step, you already added a translator to monitor these thresholds. Now, you’ll connect the output from that translator to trigger a rule.
You’ll add a condition to a device—and when that condition is met, an action of your choice is triggered. This could be anything from sending an email, create a log that requires user acknowledgement to executing a command. All of this is managed in the Rule Engine, found under the Apps menu.
Learn More
- Rule Engine documentation: here
- Rule Engine Report Generator documentation: here
- Training material Rule Engine including complete rule based on an alarm translator: Rule Engine
Step 10 - Calculations and Aggregated Measurements
Calculated nodes let you perform aggregations and derive meaningful values from your IoT data—such as the average, maximum, or minimum temperature across a building, or how quickly values are changing over time. They are commonly used to summarize data from multiple sources, such as level sensors, energy meters, or water meters, and are a powerful way to generate KPIs (Key Performance Indicators) that can be visualized in dashboards or reports.
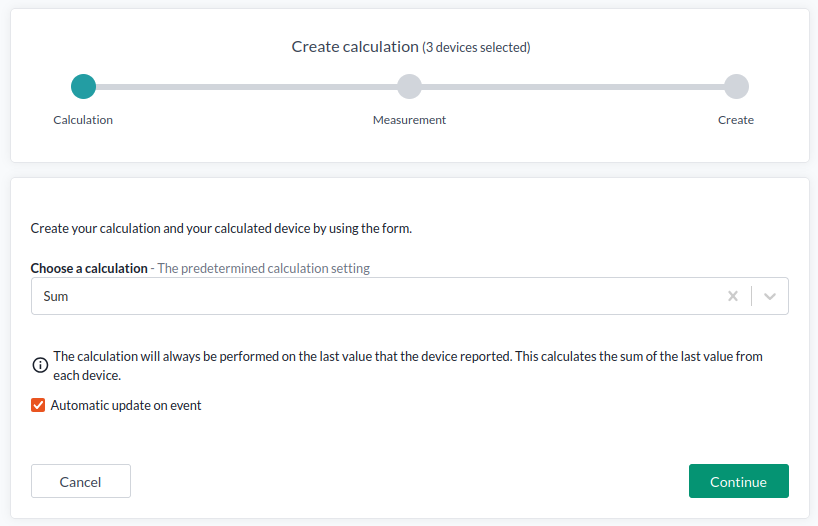
One Calculation per Node – or More?
By default, each calculated node contains a single calculated measurement. However, if you're working through the API, you can assign multiple calculations to a single IoT node. This is particularly useful in advanced use cases where multiple KPIs are required from the same set of input data—for example, when generating reporting metrics or creating a multi-metric views.
When Not to Use Calculations
Important: Calculations are not well-suited for cases where logic or conditions must be applied to incoming data before aggregation. For those scenarios, use a data flow, such as an Additional Device Update via a customized translator.
Examples where data flows are better suited:
- Filtering out invalid or noisy data before aggregation
- Performing conditional calculations (e.g., only sum values if a status is "active")
- Applying unit conversions or normalization before aggregating
Learn More including sample Use Cases
- Training material [calculations] (lesson-1-10-calculations.md)
- User guide Calculations: here
The extended workflow
Once you're comfortable with the fundamentals covered in Lesson 1, you're ready to move on to more advanced capabilities of the platform with the Extended Work Flow.
Lesson 2 takes a deeper dive into key topics such as data sharing, connectors, 3rd-party app integrations, and custom data flows—all essential for building scalable and intelligent IoT solutions.
Continue to Lesson 2: The Extended Workflow