LoRaWAN sensor network for reliable data communication and long sensor battery life
1. Introduction
The rapid growth of the Internet of Things (IoT) is driving increased demand for reliable and energy-efficient wireless communication solutions capable of long-range transmission. LoRaWAN (Long Range Wide Area Network) has established itself as a leading technology within LPWAN (Low-Power Wide-Area Network), designed to enable low-bitrate transmissions over long distances. By operating in unlicensed frequency bands, LoRaWAN offers flexible and cost-effective opportunities across a wide range of industries, from smart cities and agriculture to industrial monitoring and building automation.
However, implementing a successful LoRaWAN network requires careful management of multiple factors that impact the performance and battery life of connected devices. Typical challenges include understanding network topology, managing signal strength measurements (such as RSSI and SNR), and mitigating and handling interference from both the environment and other radio transmitters.
To achieve reliable operation and maximize sensor battery life, it is essential for LoRaWAN users to develop a solid understanding of the technology’s fundamental principles and best practices for operation.
The purpose of this white paper is therefore to:
- Explain the fundamentals: Introduce key concepts in wireless communication and LoRaWAN operation, including network topology, architecture, and communication principles.
- Explore radio signal propagation in real-world environments, including concepts such as link budget, interference, and attenuation—especially in relation to modern energy-dense buildings that can significantly reflect or dampen signals.
- Describe how battery-powered LoRaWAN sensors can be configured and optimized to achieve long battery life by ensuring network performance quality.
- Provide practical recommendations for network planning, sensor configuration, and troubleshooting to help users maximize coverage, reliability, and energy efficiency.
By integrating these topics, this document serves both as an introduction for new users and as a practical reference guide for more experienced users. As IoT solutions become increasingly prevalent across various sectors, understanding the interaction between network infrastructure, radio environments, and sensor configurations is crucial for creating scalable, high-quality, and long-term sustainable IoT systems.
2. Wireless sensor networks
Modern communication networks are increasingly utilizing wireless technology to connect everything from smartphones and laptops to IoT sensors and industrial machines. The shift from traditional wired connections is driven by several key advantages:
- Flexibility: Wireless solutions enable device placement in locations where cabling is impractical or costly.
- Scalability: Adding new devices to a wireless network is typically faster and easier than installing new network cables, which is especially important in large-scale IoT deployments with hundreds or thousands of devices.
- Mobility: Devices that require free movement, such as drones, mobile robots, and wearable technology, rely on wireless communication for continuous connectivity without physical constraints.
Despite these advantages, there is no universal wireless protocol that suits all scenarios. The choice of radio technology depends on specific requirements such as data volume, range, energy consumption, and latency. For example:
- High-bandwidth, short-range applications, such as video streaming or real-time communication, often use protocols like Wi-Fi or cellular networks (4G/5G). These technologies provide high performance but require more power, negatively impacting battery life.
- Low-power, long-range IoT sensors, such as those used for remote monitoring, rely on protocols like LoRaWAN, Sigfox, or NB-IoT. These offer low data rates but excellent battery life and extended range.
- Local mesh networks and automation systems, such as home automation and industrial control, often use technologies like Zigbee, Z-Wave, or Bluetooth Mesh, which provide low to medium data rates along with multi-hop communication capabilities.
Choosing the most suitable wireless protocol requires carefully balancing factors such as range, power consumption, data rate, latency, and network complexity. Each application area—from consumer electronics and industrial automation to agricultural monitoring and smart city infrastructure—has specific requirements that must be met for optimal functionality.
In this chapter, we will explore network topologies, signal properties, and interference in detail to help users understand and effectively design robust wireless networks that meet the unique demands of various use cases.
2.1 Network topologies
Wireless networks can be divided into different topologies, each with trade-offs in terms of coverage, scalability, fault tolerance, and complexity. Below are descriptions of some of the most common wireless network topologies.
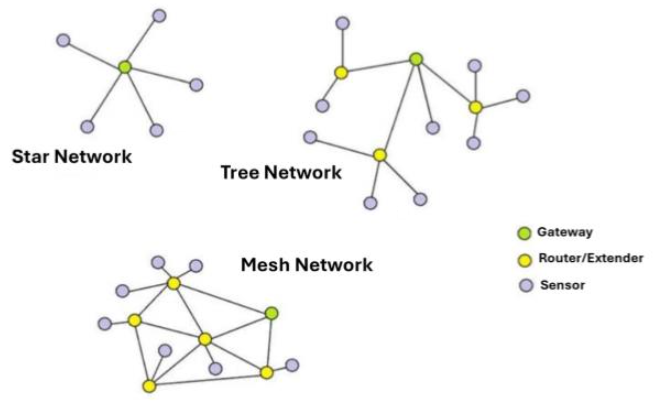
2.1.1 Star topology
In a star topology, all end devices (e.g., sensors, nodes) communicate directly with a central coordinator or gateway. The gateway routes data between each node and the broader network.
Advantages
- Simplicity: A straightforward design where each node connects to a central point.
- Easy deployment: Adding or removing nodes requires minimal configuration changes.
- Lower latency: Data is transmitted directly from the node to the gateway.
Disadvantages
- Single point of failure: If the central gateway fails, communication with all nodes is lost.
- Limited coverage: Nodes must be within direct range of a gateway.
Typical Use Cases
- LoRaWAN
- Wi-Fi hotspots
- Simple sensor networks
2.1.2 Mesh topology
In a mesh topology, some nodes can also function as routers, forwarding data between each other to form a connected network.
Advantages
- High fault tolerance: Traffic can be rerouted if a node or link fails.
- Extended coverage: Large distances between nodes are possible due to multi-hop communication.
- Scalability: Adding more nodes enhances network robustness.
Disadvantages
- Complexity: Routing algorithms and synchronization become more advanced.
- Higher power consumption: Nodes must remain active to forward traffic.
- Latency: More hops can lead to increased response times and reduced data throughput.
Typical Use Cases
- Zigbee, Z-Wave, and Bluetooth Mesh
- Smart home and industrial networks
2.1.3 Tree topology
In a tree topology, a hierarchical structure is formed where a central root node communicates with intermediate nodes (routers), which in turn connect to end devices.
Advantages
- Structured expansion: Branches can be added to extend coverage.
- Managed traffic flow: A clear hierarchy simplifies traffic routing.
Disadvantages
- Vulnerability: A router failure affects all its subordinate nodes.
- Complex coordination: The main node must manage the entire hierarchy.
2.1.4 Peer-to-peer topology (ad hoc)
In a peer-to-peer topology, devices communicate directly with each other without a central coordinator.
Advantages
- No central dependency: Devices interact directly with one another.
- Flexible: Can be deployed in various environments without requiring a fixed infrastructure.
Disadvantages
- Limited scalability: Increasing the number of nodes can quickly add complexity.
- Routing complexity: Managing data exchange between multiple peers can be challenging.
Typical Use Cases
- Bluetooth communication between two devices
- Ad hoc networks for rapid deployments in field operations or emergency situations
2.1.5 Hybrid topologies
Hybrid topologies combine multiple network topologies to enhance flexibility and robustness. For example, LoRaWAN star networks can be interconnected via mesh or point-to-point links within a tree network.
2.2 Signal, noise and interference
Wireless performance is influenced by much more than just transmitter power, receiver sensitivity, and the distance between the transmitter and receiver. Factors such as signal attenuation, reflections, and various interferences play a significant role in the reliability and efficiency of the network.
Key metrics like RSSI (Received Signal Strength Indicator) and SNR (Signal-to-Noise Ratio) help quantify link quality, enabling network optimization.
2.2.1 Indicator for received signal strength (RSSI)
RSSI (Received Signal Strength Indicator) measures the total received signal strength at the receiver, typically expressed in dBm. The value includes not only the desired signal but also nearby noise and interference within the receiver’s bandwidth.
- A higher RSSI value generally indicates a stronger received signal, which can be beneficial.
- However, a high RSSI does not always guarantee reliable communication, especially if a significant portion of the signal strength comes from interference rather than the intended signal.
It is crucial to measure and analyze RSSI at both the sensor and the gateway. Differences between these measurement points can reveal critical aspects of bidirectional communication quality and provide valuable insights for network performance optimization.
2.2.2 Signal to noise ratio (SNR)
SNR (Signal-to-Noise Ratio) compares the strength of the desired signal to the level of the underlying noise floor, expressed in dB. The noise floor consists of random noise (white noise) as well as potential specific interferences.
Key Aspects of SNR:
- A higher SNR generally improves the receiver's ability to distinguish and decode the data signal from background noise.
- Lower packet error rate: Reduces the risk of lost or corrupted packets, leading to fewer retransmissions and lower energy consumption.
- A low or negative SNR, even if RSSI is high, indicates that the channel is experiencing significant interference, degrading link quality and increasing the risk of communication issues.
Understanding both RSSI and SNR is crucial for managing the signal environment and ensuring robust and efficient wireless communication.
2.2.3 Noise & interference
Interference refers to signals from other transmitters or sources that overlap in frequency or timing, thereby degrading wireless performance.
Common Types of Interference:
- Co-channel interference: Occurs when multiple devices or networks use the same or nearby frequency simultaneously. Examples include RFID-based access systems and wireless cameras operating in the ISM band.
- Other interference sources: Electrical devices such as electric motors, power converters, and especially mobile base stations using the 800 MHz band (LTE Band 20). These can raise the noise floor or overload the receiver, degrading LoRaWAN communication in the 868 MHz band.
2.2.4 Noise affecting network performance
When the receiver is more affected by noise or interference than the desired signal—meaning SNR is low, the following issues can arise:
Potential Problems:
- Increased need for retransmissions and reduced data rates: The system is forced to use lower modulation rates and repeated transmissions to maintain communication reliability.
- Decreased range and coverage: Even if a device is within the physical coverage area, high noise or interference can prevent effective communication.
- Higher energy consumption: Battery-powered sensors and devices may need to increase transmission power, lower data rates, or attempt multiple retries, leading to faster battery drain and shorter battery life.
- Lost data packets: More dropped or lost packets due to noise and interference, resulting in less reliable communication.
3: LoRaWAN basics
LoRaWAN is an LPWAN (Low Power Wide Area Network) protocol designed for IoT applications that require low data rates, wide geographic coverage, and long battery life. LoRaWAN is developed and maintained by the LoRa Alliance and is primarily used in large-scale IoT networks where low data rates and extended battery life are critical.
Unlike cellular networks, LoRaWAN operates in unlicensed frequency bands, making it cost-effective and easy to deploy over large geographic areas.
This chapter introduces the fundamental components of LoRaWAN, including its network architecture, signal characteristics, and data rate strategies. Understanding these core principles is essential for successfully implementing robust, scalable, and energy-efficient LoRaWAN networks.
3.1 Architecture
LoRaWAN is based on a star topology, with an architecture primarily consisting of three key components:
- End devices (sensors or nodes) that communicate directly with gateways using LoRa modulation.
- Gateways, which receive signals from sensors and forward them via an IP-based backhaul (such as Ethernet, cellular networks, or other technologies).
- A central network server, which manages network security, packet routing, and communication with end devices.
All gateways within range of a sensor can forward data to the network server, enhancing redundancy and reliability.
3.1.1 LoRaWAN System Components
End Devices (Nodes, Sensors, and Actuators)
- Battery-powered devices that use LoRa modulation to transmit and, in some cases, receive data.
- Classified into three operational classes (A, B, or C), which determine when and how the device listens for downlink messages (see section 5.1).
Gateways
- Act as a bridge between LoRaWAN devices and the network server.
- Can simultaneously listen on multiple channels and at different data rates. Each gateway that receives a signal from an end device forwards it to the network server.
- Also relays control data from the network server to end devices, including configuration updates and acknowledgments.
Network Server
- The central component responsible for message routing, security functions, and device management.
- Removes duplicate messages received from multiple gateways and selects the best path for potential downlink communication.
- Ensures that only authenticated devices can participate in the network and maintains message integrity.
IoT Platform / IoT Application
- Integrated with a LoRaWAN application server.
- It contains application-specific logic and is responsible for processing, visualizing, or storing data from end devices.
- Communicates with the network server through secure interfaces and APIs.
- Manages downlink messages to control actuators and devices via the network server.
3.1.2 LoRaWAN Security: Ensuring Data Confidentiality and Integrity
LoRaWAN implements end-to-end encryption to protect data confidentiality and integrity:
-
Two session keys:
- NwkSKey (Network Session Key): Protects the network address and ensures message integrity.
- AppSKey (Application Session Key): Encrypts the actual data payload.
-
Uplink Communication (Device → Gateway → Network Server):
- Data is encrypted using AppSKey.
- Message integrity is verified with NwkSKey.
-
Downlink Communication (Network Server → Gateway → Device):
- Only the intended device can decrypt and validate the message.
- This is ensured through reverse encryption and integrity validation.
-
Data Protection:
- Effectively prevents eavesdropping and tampering.
- Enables secure communication, even over shared or public networks.
3.1.3 LoRaWAN Communication Flow
Uplink (Broadcast)
- The end device transmits a LoRa packet on a selected frequency and data rate.
Gateway Reception
- All gateways within range receive the message and forward it to the network server via an IP-based backhaul.
Network Server Processing
- Eliminates duplicate messages received from multiple gateways.
- Validates message integrity using NwkSKey.
- Decrypts data with AppSKey, if necessary, and forwards it to the IoT platform/application server.
IoT Platform
- Processes data, stores information, and can generate downlink commands if needed.
Downlink
- Commands and data from the IoT platform are sent through the network server and gateways back to the end device.
- Only the intended device can decrypt and validate the message.
3.2 LoRaWAN signalling and encoding
LoRaWAN is based on LoRa modulation, a form of Chirp Spread Spectrum (CSS). This technique spreads a narrowband signal over a wide frequency range, resulting in:
- Very high receiver sensitivity, enabling long-range communication.
- Strong resistance to interference, improving reliability in noisy environments.
These characteristics make LoRaWAN an optimal choice for low-power, long-distance communication, particularly in IoT applications.
3.2.1 Chirp Spread Spectrum (CSS)
A chirp is a signal whose frequency continuously changes over time within a given frequency band.
LoRa utilizes different spreading factors (SF), where:
- Higher SF values result in greater receiver sensitivity and longer range but lower data rates.
- Lower SF values provide higher data rates but reduced range and sensitivity.
This trade-off allows LoRaWAN to adapt communication parameters based on network conditions and device requirements.
3.2.2 Error correction (FEC)
LoRaWAN employs forward error correction (FEC) with coding rates ranging from 4/5 to 4/8 to correct erroneous bits without requiring retransmissions.
This enhances:
- Reliability: Improves data integrity, even in noisy environments.
- Interference resistance: Reduces the impact of signal disruptions.
- Efficiency: Minimizes retransmissions, conserving bandwidth and energy.
FEC allows LoRaWAN devices to maintain communication stability in challenging conditions while optimizing power consumption and network performance.
3.2.3 Bandwidth
The bandwidth in LoRaWAN is typically 125 kHz, 250 kHz, or 500 kHz, which directly impacts the symbol rate.
- Wider bandwidth results in higher data rates, allowing faster transmissions.
- However, wider bandwidth reduces range and receiver sensitivity.
- Narrower bandwidth improves range and sensitivity but lowers data throughput.
3.2.4 Long range
The combination of Chirp Spread Spectrum (CSS) modulation and Forward Error Correction (FEC) gives LoRaWAN long range even at low power.
Signals can still be detected even below the noise floor.
3.2.5 NB_Trans defines multiple transmissions
LoRaWAN includes the NB_Trans function, which allows the network server to instruct a device to send the same message multiple times.
This is typically used in poor signal conditions to increase the chances that at least one transmission successfully reaches a gateway.
While NB_Trans enhances reliability, it also significantly increases energy consumption. Therefore, it is primarily used in situations where ensuring data delivery is critical.
3.3 Data rate (DR) och adaptive data rate (ADR)
In LoRaWAN, the data rate (DR) is directly linked to the spreading factor (SF) and bandwidth (BW).
Adaptive Data Rate (ADR) enables dynamic optimization of both data rate and transmission power, typically managed by the network server.
- For stationary devices, ADR is especially valuable, as it allows them to switch to a lower SF (and, when possible, lower transmission power) to save energy once a stable link is established.
- For mobile devices, where signal conditions change continuously, a custom ADR strategy with faster local adaptation may be used instead.
3.3.1 Data rates and spreading factors (EU868)
In the EU868 region, data rates (DR) are defined by the following combinations of spreading factor (SF) and bandwidth (BW):
DR0 → SF12 @ 125 kHz
DR1 → SF11 @ 125 kHz
DR2 → SF10 @ 125 kHz
DR3 → SF9 @ 125 kHz
DR4 → SF8 @ 125 kHz
DR5 → SF7 @ 125 kHz
A lower spreading factor (e.g., SF7) provides higher data rates and lower energy consumption per transmitted packet, but results in shorter range and lower receiver sensitivity.
A higher spreading factor (e.g., SF12) extends communication range, but leads to longer transmission times and higher energy consumption.
3.3.2 Join process
By default, devices use the slowest data rate (SF12) during the initial connection attempt to maximize the chances of reaching a gateway, especially in challenging coverage conditions.
However, each attempt at SF12 with high transmission power (+14 dBm) consumes significantly more energy compared to using lower SF and power settings.
3.3.3 Regulating the transmitter power
ADR (Adaptive Data Rate) can also adjust transmission power within regulatory limits.
A device with good coverage can be instructed to reduce its transmission power from +14 dBm to, for example, +2 dBm or –10 dBm, significantly lowering battery consumption when signal quality allows it.
3.3.4 Energy usage
For a 10-byte uplink in EU868, the energy consumption difference between SF7 at -10 dBm and SF12 at +14 dBm is as follows:
-
SF7, -10 dBm:
- Transmission time: ~50 ms (0.05 s)
- Transmission current: ~15 mA
- Energy consumption: ~0.000208 mAh
-
SF12, +14 dBm:
- Transmission time: ~1.5 s
- Transmission current: ~45 mA
- Energy consumption: ~0.01875 mAh
This means that a single uplink with SF12 and high power consumes approximately 90 times more energy than the same transmission with SF7 at low power.
3.3.5 Energy Impact of Network Joining
Devices initiating a network join at SF12 consume significant energy, as the joining process includes:
- At least one JoinRequest transmission
- Two reception windows for JoinAccept
- Potential retransmissions if the connection attempt fails
The total energy consumption for this process is substantially higher compared to regular data transmissions.
3.3.6 ADR strategies
-
Network-controlled ADR:
- Suitable for stationary devices in stable radio environments.
- The network server analyzes signal history and optimizes SF and transmission power accordingly.
-
Device-controlled ADR:
- Effective for mobile devices.
- The device independently and quickly adjusts SF and transmission power based on local signal measurements, improving performance in dynamic radio conditions.
-
Fixed Data Rate (Fixed DR):
- Simplifies management by maintaining a constant DR value.
- However, it may compromise battery life or coverage if the radio environment changes significantly.
4: Environmental impacts
Wireless network performance is influenced by environmental factors that can enhance or degrade signal quality. To optimize a LoRaWAN network, it is crucial to understand:
- How signals propagate
- How interference occurs
- How the environment affects coverage and battery life
LoRaWAN’s low-power, long-range communication makes it particularly sensitive to small changes in:
- Gateway placement
- Building materials
- Sources of interference
4.1 Transmission of signals
LoRaWAN uses a "broadcast-and-forward" method, where sensors transmit data that is received by all gateways within range.
Each gateway then forwards the data to the network server, ensuring redundancy and improved reliability in the communication process.
4.1.2 Down-link (Gateway => Sensor)
LoRaWAN is bidirectional, allowing gateways to communicate back to sensors for:
- Acknowledgment (ACK) of received data.
- Configuration changes and ADR commands to optimize transmission settings.
- Link control and reconnection in case of poor coverage.
- JoinAccept messages during the initial network join process.
4.1.3 Considerations for Bidirectional Timing and Latency in LoRaWAN
Most LoRaWAN sensors are Class A devices. They listen for downlink messages during two short receive windows after each uplink transmission. Delays or latency in the network (between the gateway and network server) can cause missed downlinks, leading to increased energy consumption and reduced functionality. Therefore, careful network planning is crucial to ensure low latency between network components.
4.2 Radio link budget
A radio link budget is used to estimate whether a wireless link between a transmitter (sensor) and a receiver (gateway) will function.
The link budget calculates the total gains (transmission power, antenna gains) and subtracts all losses (path losses, obstacles, cables) to ensure that the received signal is stronger than the receiver's sensitivity threshold.
A simple link budget equation:
Link Budget = Transmission Power + Antenna Gains − Losses ≥ Receiver Sensitivity
- A positive link budget indicates that the link is reliable.
4.2.2 Impact of spreading factor (SF)
LoRaWAN’s spreading factor (SF) affects receiver sensitivity:
High SF (e.g., SF12):
- Very high receiver sensitivity (larger link budget).
- Longer transmission time and lower data rate.
- Suitable for long distances or challenging radio environments.
Low SF (e.g., SF7):
- Lower sensitivity (smaller link budget).
- Shorter transmission time and higher data rate.
- Ideal for good coverage and shorter distances.
For example, if a gateway's sensitivity is -123 dBm at SF7 and -137 dBm at SF12, SF12 provides an extra 14 dB link margin. However, it also results in longer transmission times and significantly higher energy consumption per message compared to lower SF values.
A strong link budget allows more devices to operate at lower SF, reducing collisions and transmission time usage.
4.2.3 Practical Considerations
Device Placement and Environment:
- Urban areas with tall buildings or modern radio-dense structures can degrade the link budget due to increased signal attenuation.
Gateway Distribution:
- Strategically placed gateways with minimal obstacles allow devices to use lower SF, increasing data rates and reducing battery consumption.
Adaptive Data Rate (ADR):
- As explained in Section 3.3, ADR dynamically adjusts SF to optimize the link budget in real-time, helping devices maintain efficient communication.
Example: SF7 vs. SF12
- If a gateway's sensitivity is -123 dBm at SF7 and -137 dBm at SF12, devices using SF12 benefit from ~14 dB additional margin to compensate for path loss.
- However, each SF12 transmission can be 20–30 times longer than SF7, leading to higher battery consumption if used frequently.
4.3 Attenuation
Attenuation describes how signal strength decreases as radio waves travel through different materials and environments.
By understanding how attenuation affects the signal, gateway and sensor placement can be optimized to maximize range and improve network performance.
4.3.1 Common causes of attenuation
Building Materials:
- Concrete and brick: Typically 10–30 dB attenuation per wall, depending on thickness.
- Reinforced concrete: The metal inside increases attenuation further.
Vegetation and Forests:
- Dry forest and vegetation: Around 0.5–1 dB per meter.
- Dense, humid forest: Can increase to 1–2 dB per meter.
Ground and Soil:
- Dry soil: Approximately 10 dB per meter.
- Moist or wet soil: Can increase significantly to 20 dB or more per meter.
Energy-Efficient Buildings:
- Insulation with metal foil: 20–40 dB per wall.
- Metal-coated windows: 10–30 dB per window.
Weather and Humidity:
- Rain or snow: Can add a few dB of attenuation over long distances.
- Wet foliage: Causes higher attenuation compared to dry vegetation.
Humans and Animals:
- The human body and animals contain water, which absorbs signals at 868 MHz, potentially affecting coverage in crowded environments.
By considering these factors, gateway placement and sensor installations can be optimized for stable and energy-efficient network coverage.
4.3.2 Vertical coverage
Most LoRaWAN antennas are designed for optimal horizontal signal distribution in a 360-degree pattern, which results in limited vertical coverage:
-
Outdoor Gateways:
- Devices located directly below a gateway often experience weaker signal strength, as antennas have limited downward radiation.
-
Indoor Gateways:
- Typically cover 2–3 floors above and below the installation point.
- Concrete slabs and metal reinforcements further reduce vertical range.
- Specialized antennas may be required if clear vertical coverage is essential.
4.3.3 Antenna placement
When a LoRaWAN (or any sub-GHz) gateway is mounted at or near ground level, radio signals are significantly affected by the earth’s surface and nearby obstacles. Several factors reduce range in ground-mounted scenarios:
-
Fresnel Zone Obstruction:
- At around 1 GHz, the lower part of the Fresnel zone (the elliptical area around the direct line of sight) can be blocked or disturbed by the ground.
- Even small obstacles in the Fresnel zone cause diffraction and additional path loss, often adding several dB of attenuation per obstructed link.
-
Ground Reflection & Multipath Interference:
- Signals reflecting off the ground can interfere destructively with the direct signal path.
- This multipath effect is particularly strong when the antenna is mounted at low height, leading to partial signal cancellation.
-
Near-Ground Scattering & Diffraction:
- Grass, bushes, rocks, or artificial objects near ground level contribute to scattering and diffraction, further weakening the line-of-sight component.
-
Antenna Height & Line-of-Sight Improvements:
- In flat, open areas, a gateway placed only 1–2 meters above ground significantly reduces its ability to "see" over small hills or vegetation.
- Raising the antenna to 6–10 meters (e.g., on a mast) extends the line of sight, allowing signals to clear low-level terrain and debris.
Estimated Signal Loss Due to Low Mounting
- Mounting a gateway at ground level can introduce an additional 10–20 dB of path loss compared to an elevated antenna, depending on local terrain and obstructions.
- This extra loss can cut the coverage radius in half or even reduce it to a quarter in some rural or semi-open environments.
- The impact is even more severe in urban or forested landscapes, where obstructions and multipath effects are more pronounced.
5: Battery powered LoRaWAN units
One of the key advantages of LoRaWAN is the ability to power sensors for 10 years or more on a single battery. This makes the technology particularly suitable for large-scale deployments, where frequent battery replacement is impractical or costly.
To achieve maximum battery life, several factors must be carefully balanced.
5.1 Device classes
- Class A: Lowest energy consumption; devices enter deep sleep and only wake up to transmit data and briefly listen for a response.
- Class B and C: Higher energy consumption as devices listen more frequently for incoming messages.
5.2 Critical and non-critical messages
Critical Alarms and Messages
- Examples: Leak alarms, fire alarms, security warnings.
- These messages are typically sent as confirmed messages, and the device continues to transmit until an acknowledgment is received from the network.
Routine or Non-Critical Data
- Examples: Regular temperature and humidity measurements.
- Usually sent unconfirmed to reduce energy consumption by avoiding repeated retransmissions.
Devices with Multiple Sensors
- Examples: A device measuring temperature, air quality, and motion.
- Critical data (e.g., motion detection) can be sent as confirmed messages, while less important data (e.g., temperature) is sent unconfirmed to conserve battery life.
5.3 Practical examples of LoRaWAN devices balancing energy consumption and reliability
1. Periodic Temperature Sensor
- Wakes up every 15 minutes, measures temperature, and sends an unconfirmed uplink.
- Can be configured to only send data if the temperature changes by at least 0.2°C since the last transmission.
- Briefly listens for downlink messages, then returns to sleep mode.
- In good coverage conditions, occasional packet loss is acceptable, as temperature data is not mission-critical.
2. Water Leak Detector
- Continuously monitors moisture with low power consumption.
- Wakes up and immediately sends a confirmed alarm signal upon detecting moisture.
- Retransmits until an acknowledgment (ACK) is received or the maximum number of attempts is reached.
- Can receive downlink commands for additional diagnostics or reconfiguration.
3. Desk Occupancy Sensor
- Monitors workspace occupancy, e.g., using a PIR sensor or pressure pad.
- Sends a confirmed uplink when occupancy changes to ensure the network registers the event.
- Sends periodic unconfirmed status updates at longer intervals to provide an overview, even if no changes have occurred.
5.4 Network performance impacting sensor battery life
The coverage quality and environment where LoRaWAN sensors are placed have a direct and significant effect on battery life.
-
Poor network coverage forces sensors to use higher spreading factors (SF), leading to longer transmission times and higher energy consumption per message.
- This can drastically reduce battery life from several years to just months or weeks.
-
High levels of interference (e.g., from other radio sources or electrical equipment) can further worsen the problem by requiring:
- Multiple transmission attempts (retries) to successfully send data.
- Network-server-enforced retransmissions (NB_Trans > 1) to increase message delivery probability, further increasing energy consumption.
-
Frequent re-joins due to unreliable coverage can be extremely energy-intensive:
- Each re-join requires a series of transmissions at high SF and maximum transmission power, significantly increasing total energy consumption.
Optimizing Network Design for Maximum Battery Life
To mitigate these issues, it is crucial to:
- Carefully plan gateway placement to ensure optimal coverage.
- Design the network to allow sensors to communicate at the lowest possible SF with minimal retransmissions.
A well-optimized network saves energy, reduces operational costs, and ensures maximum battery life for sensors.
5.5 Link checks and re-joins
Even with robust coverage, LoRaWAN devices can lose connection due to environmental changes, gateway failures, interference, or network infrastructure modifications.
Another common reason is a network server restart, replacement, or loss of device session keys. To detect and recover from such issues, devices can perform link checks and, if necessary, rejoin the network.
Link CheckPurpose: Verify continuous communication with the network.
Frequency: Can be performed periodically (e.g., daily) or when coverage deterioration is detected.
Battery Impact: Minimal, but frequent link checks increase power consumption.
Re-join ProcedurePurpose: Restore session security keys and network synchronization.
Procedure: The device attempts a new network join using maximum power at high SF (SF12), which is highly energy-intensive.
Energy Cost:
- Significantly higher than normal uplinks.
- Frequent re-joins can drastically shorten battery life, especially in poor coverage areas.
5.6 Reporting battery status
Accurate battery reporting is crucial for battery-powered LoRaWAN devices, enabling users or network servers to monitor remaining energy and schedule replacements or maintenance.
The simplest method measures battery voltage—often at regular intervals—and estimates the remaining capacity using a known discharge curve.
More advanced techniques include internal resistance, temperature, and usage history to provide more precise battery life estimates.
5.6.1 Battery model
For battery-powered LoRaWAN devices, accurate battery reporting is essential for monitoring remaining energy and scheduling maintenance.
The most common method is measuring battery voltage at rest (OCV – Open Circuit Voltage), which depends on battery charge level and temperature.
More advanced techniques measure voltage drop across the battery's internal resistance under a known load or continuously estimate energy consumption during each activity.
5.6.2 Replaceable versus built-in batteries
Replaceable Batteries:
- Often rely on voltage measurement at rest or under load as a simple indicator.
- Users can replace the battery when voltage drops below a set threshold.
- Variations between manufacturers may result in different end-of-life voltages, requiring devices to enforce a conservative shutdown to ensure stable operation.
Built-in Batteries:
- Can use more advanced battery monitoring methods, such as coulomb counting or sophisticated algorithms, since the device manufacturer knows the exact battery chemistry and internal characteristics.
- Allows for more reliable battery reporting.
5.7 Battery life impacted by the network
With the following assumptions – standby current = 1.5 μA, TX current = 40 mA, RX current = 5 mA, a 10-byte uplink every 15 minutes (96 times/day), and minimal retransmissions – the table below provides rough battery life estimates for a 500 mAh battery and does not account for additional battery drain due to message retransmissions in poor network conditions.
| Spreading factor | Approx. Transmission time (ms) | Estimated battery life |
|---|---|---|
| SF7 | ~50–60 | ~17 years |
| SF8 | ~100–110 | ~15 years |
| SF9 | ~180–200 | ~13 years |
| SF10 | ~370–410 | ~11 years |
| SF11 | ~740–820 | ~7 years |
| SF12 | ~1480–1600 | ~5 years |
Note: In LoRaWAN networks with weak coverage and high interference, the LoRaWAN server may request the device to transmit each data packet multiple times (NB_Trans > 1). Additionally, a device sending confirmed messages may need to retransmit multiple times if it does not receive an acknowledgment for the sent data.
This can further reduce battery life by up to 75%.
6 Recommendations
6.1 Network
A well-planned and optimized LoRaWAN network is essential for achieving high reliability, low energy consumption, and good scalability. By following these guidelines, communication issues can be avoided, and battery-powered devices can reach their expected lifespan.
Evaluate the Environment
- Map physical obstacles: Identify walls, metal structures, foil-insulated buildings, forests, and hilly terrain that could attenuate or block signals.
- Locate potential interference sources: Check for industrial machines, other ISM-band devices (e.g., NB-IoT, Sigfox), or strong nearby transmitters (e.g., cellular base stations) that may increase noise levels.
- Conduct signal measurements: Measure actual signal strength (RSSI) and signal-to-noise ratio (SNR) at planned device locations, especially in indoor and underground environments.
Establish a stable gateway infrastructure
- Strategic placement: Install gateways at high locations to minimize obstacles and ensure wide coverage.
- Redundancy and reliability: Plan for overlapping coverage with multiple gateways in critical areas to reduce the risk of single points of failure.
- Backhaul connection: Ensure that gateways have stable, low-latency backhaul connections (Ethernet, cellular, fiber) to allow fast data transmission and reduce packet loss risk.
- Ensure the LoRaWAN server is configured to handle backhaul latency (RX1_Delay), which may need to be extended if one or more gateways are connected via satellite or mobile networks.
Optimize spreading factors and network load
- Target SF7–SF9: Devices should operate at the lowest possible spreading factor (SF) to minimize transmission time, conserve battery, and reduce network congestion.
- Identify poor coverage areas: If many devices consistently use SF10–SF12, investigate coverage gaps. Adjusting gateway placement is often more effective than allowing devices to use higher SF values.
- Use indoor gateways:
- Many buildings have metal-coated windows and metal foil insulation that reflect heat—and also radio signals.
- Indoor gateways should be considered to improve coverage and reduce the need for high SF.
Conduct pilot testing before full deployment
- Install devices in the most challenging environments and evaluate their performance.
- If testing reveals high SF usage, lost data packets, or NB_Trans >1, corrective actions are needed.
- Verify redundancy: Simulate a gateway failure to ensure devices can still connect through nearby gateways.
Ongoing monitoring and maintenance
- Ensure all gateways are online and have stable backhaul connections.
- Use network server and IoT platform statistics/logs to identify weak coverage areas or interference sources.
- Adjust network infrastructure when adding new devices or modifying coverage requirements.
6.2 Deploying sensors
A well-prepared network is the foundation for successful smart services. Once gateways are in place and coverage has been verified, the next step is to deploy sensors.
Ensuring reliable device connectivity, selecting the right configuration (e.g., reporting intervals, confirmed vs. unconfirmed messages), and validating link quality can significantly improve uptime and battery efficiency.
6.2.1 Joining sensors
LoRaWAN devices typically initiate the connection process using the highest spreading factor (SF) and maximum transmission power to maximize coverage. This process requires two-way communication with the network server.
-
If a sensor struggles to connect (e.g., multiple failed attempts), it likely indicates:
- Coverage issues
- Incorrect device credentials
- Delays in the gateway-to-network server link (RX1_Trans may need to be increased)
-
Persistent connection issues can drain the battery quickly, as each new attempt at SF12 consumes significant energy.
6.2.2 Configurating sensors
Carefully Plan How Often and When the Sensor Should Report Data
- Reporting Interval
-
Time-Based:
- Sending data every 5, 15, or 60 minutes is simple but may be excessive if changes are minimal, leading to unnecessary battery drain.
-
Event-Driven:
- The sensor only transmits when a threshold or trigger is met (e.g., leak detected, occupancy change).
- This approach conserves battery life while providing timely alerts.
- Confirmed vs. Unconfirmed Messages
-
Critical Data:
- Alarm or event-based messages may require confirmed uplinks to guarantee delivery.
- The device retransmits until an acknowledgment is received.
-
Routine Data:
- Unconfirmed messages are often preferred, minimizing battery usage and network load.
-
Hybrid Strategy:
- A device can use confirmed messages for urgent events and unconfirmed messages for periodic status updates.
6.2.3 Post-Deployment Checks
Monitor RSSI, SNR, and SF:
- Low signal values and high SF may indicate coverage issues.
Analyze Retransmissions and Rejoins:
- High retransmission or reconnection rates could signal poor coverage or interference.
Adjust Settings if Needed:
- Modify reporting intervals, acknowledgment policies, or relocate sensors to optimize performance.
7. Operating a sensor network
Deploying and configuring LoRaWAN sensors is just the first step; ongoing operation and network monitoring are essential to maintain reliability, identify coverage issues, and optimize battery usage.
A well-structured operational plan ensures that minor issues—such as a gateway going offline or sensors switching to higher spreading factors—are detected and resolved before they become major problems.
7.1 Monitor sensors
Spreading Factor and Signal Strength
- Monitor SF to ensure that devices do not remain stuck on high SF levels.
- Track RSSI and SNR to identify coverage or interference issues.
Uplink Frequency and Reliability
- Verify that sensors transmit data at the planned intervals.
- Check frame count continuity to detect potential data loss.
Channel Balance and NB_Trans
- Ensure traffic is evenly distributed across all channels. If some channels show lower traffic, this may indicate interference.
- Check that NB_Trans is consistently set to 1, avoiding unnecessary duplicate transmissions.
7.2 Monitor gateways
- Implement automatic checks (e.g., ping or SNMP-like monitoring) to confirm that each gateway remains online and has a healthy backhaul connection.
- Regularly review gateway logs to detect potential issues or anomalies.
7.3 Securing operations
Coverage
- Environmental changes (e.g., new buildings, construction) may reduce coverage.
- Schedule periodic site surveys or collect coverage statistics to determine if additional gateways or repositioning is needed.
Adaptive Data Rate (ADR) Adjustment
- For static sensors, ensure that ADR is enabled and correctly configured on the network server.
- Verify that devices gradually converge to a lower SF, maximizing battery life.
- If many sensors remain on higher SF, investigate network or device configuration issues.
Firmware and Configuration Updates
- Some sensors support over-the-air (OTA) updates or remote reconfiguration.
- Use these features carefully and schedule transmissions to avoid network congestion.
- Maintain an audit log of changes to allow rollback in case new configurations cause unexpected behavior.
Battery Monitoring
- Monitor battery status to prevent device failures.
- Analyze consumption trends, especially if usage patterns change.
8. Trouble shooting
Despite careful planning and monitoring, issues can arise in any LoRaWAN deployment. From sensors failing to connect to lost data or unexpectedly high battery consumption, a systematic troubleshooting approach helps identify root causes and restore normal operation quickly.
Below are common problem scenarios and recommended diagnostic steps to resolve them efficiently.
8.1 Common symptoms
- Failed or slow connections
Symptoms:
- Devices repeatedly attempt to join at SF12, consuming large amounts of battery but never receiving a JoinAccept.
Possible causes & solutions:
- Insufficient coverage → Improve gateway placement or add more gateways.
- Long gateway/network server response time → Increase RX1_Delay to ensure downlinks arrive within the device’s receive window.
- Invalid configuration (DevEUI, AppEUI, AppKey mismatch) → Verify credentials on both the device and network server.
- Interference → Nearby mobile base stations or industrial equipment could be disrupting signals, especially if they affect all channels.
- Persistent high spreading factor (SF10–SF12)
Symptoms:
- Devices remain at high SF despite being relatively close to a gateway.
Possible causes & solutions:
- Local interference → Identify and eliminate the source, move the gateway/sensor, or block the affected channel in the network server.
- Gateway or antenna issues → Check for faulty cables, damaged connectors, or antenna problems.
- High latency between gateway and LoRaWAN network server → Optimize backhaul connection.
- ADR not enabled or misconfigured → Ensure ADR is active and correctly set on the network server.
- Environmental changes → Building renovations may introduce metal-coated windows, foil insulation, or reflective barriers, significantly increasing attenuation and forcing devices to use higher SF. Changes in interior layout can also increase radio attenuation.
- Missing or sporadic uplinks
Symptoms:
- Some sensors stop reporting for specific time periods.
Possible causes & solutions:
- Device enters rejoin mode after missing ACKs → Check if confirmed messages are required and adjust settings if necessary.
- Gateway issues → The gateway may be offline, have a slow internet connection, or be overloaded.
- Weak battery → Monitor battery voltage and consumption trends.
- Excessive retries / frequent rejoins
Symptoms:
- Network logs show devices retransmitting or rejoining multiple times, rapidly draining batteries.
Possible causes & solutions:
- Poor coverage or interference → Causes lost downlink acknowledgments, leading to retransmissions.
- Misconfigured sensor settings → Routine data should use unconfirmed messages when acknowledgments are not needed.
- Delays between gateway and network server → Missed receive windows can cause failed downlinks.
- Rapid battery drain
Symptoms:
- Sensors designed to last several years deplete within months.
Possible causes & solutions:
- High SF transmissions and long airtime → Optimize ADR to ensure lower SF is used when possible.
- Interference affecting channels → Network server may increase NB_Trans >1, forcing sensors to retransmit multiple times.
- Frequent rejoin attempts and retransmissions → Improve network reliability to prevent unnecessary energy usage.
- Inappropriate reporting interval → Reduce uplink frequency if transmissions are too frequent for the application.
- Extreme temperatures → Cold environments reduce battery efficiency, and high heat can accelerate degradation.
8.2 Methodology
Review data & network logs- Look for patterns of lost or corrupted packets (Are frame counts missing?).
- Check how frequently devices send JoinRequests.
- Are there signs in the log indicating a gateway has a slow internet connection?
- Do unconfirmed messages succeed more often than confirmed ones? This could indicate a slow gateway connection or sensor receiver interference from an external noise source near the sensor.
- Is data traffic evenly distributed across all channels for each gateway? Are RSSI & SNR consistent across channels? If not, some channels may be experiencing interference.
- Are data packets lost occasionally, even though multiple gateways typically receive the sensor’s signals? Are these gateways being disrupted simultaneously? If so, a periodic interference source may be emitting a strong disruptive signal.
Gateway status:
- Is the gateway running, and is the backhaul stable?
- Check for alarm conditions or offline reports.
Antenna connections:
- Inspect cables and connectors for damage, moisture, or loose connections.
Placement changes:
- Has the gateway been moved or blocked by new construction?
Nearby interference sources:
- Is the gateway positioned close to another radio transmitter, such as a mobile base station antenna?
- Firmware settings: Ensure the device is set to the correct region and has valid DevEUI/AppEUI/AppKey.
- Check sensor configuration: Verify uplink settings, reporting intervals, and message types.
- Battery voltage: Inspect the battery level to rule out low power as a cause of failures.
- RSSI/SNR measurements: Use a test device or site survey to measure signal strength in suspected areas.
- Spectrum analysis: If available, scan for strong interference in LoRaWAN channels.
- Overlapping radio networks: Verify that other networks (e.g., mobile networks or other LoRaWAN deployments) are not overloading the frequency band.
Support
For more information on LoRaWAN network settings, sensor configurations, or coverage solutions in radio-dense buildings, please contact Sensative’s support