Dashboard Reports
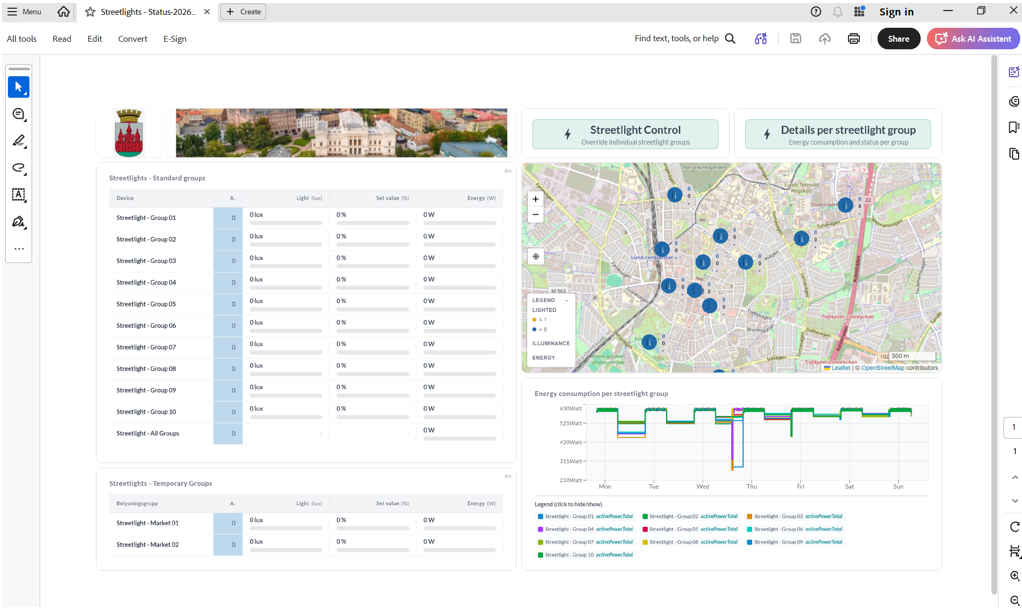
A dashboard report is a PDF of a dashboard exactly as it appears on screen. It is the quickest report in Yggio: there is no definition to write, no query and no measurement to choose. Lay the dashboard out the way you want the report to read, then export it.
It suits the recurring case of sending someone a picture of how things stand, to a tenant, a board or a customer who has no Yggio account.
Making one
- Open the dashboard.
- Press the cog icon in the dashboard header.
- Select Export as PDF.
The file downloads as <dashboard name>-<timestamp>.pdf. The timestamp means repeated exports of
the same dashboard never overwrite each other.
What you get
- The whole dashboard on one page. The page is A4 width with a 10 mm margin and grows as tall as the dashboard needs, so no widget is cut in half by a page break.
- Portrait or landscape, chosen automatically from the shape of the dashboard.
- Rendered at double resolution, so text and chart lines stay sharp in print rather than looking like a screenshot.
Widgets scale with the space they are given, which is what makes this work: a dashboard laid out for a wide screen exports as a wide, legible page rather than a shrunken one. What is on screen is what is in the PDF, so arranging the dashboard is how you design the report.
Charts and maps are given a moment to finish drawing before the capture, so exporting a dashboard that has only just opened still produces a complete picture.
What it cannot do yet
Exports are made by hand, one at a time. There is no schedule and no email delivery: the button downloads the file to the computer you are working on. Scheduled dashboard reports are planned.
If you need a report that generates itself and arrives by email, use Excel Reports, which supports both.
Related
- Dashboards - building the dashboard the report is made from
- Excel Reports - scheduled reports with email delivery
- CSV Reports - raw measurement data for another system to read