Grafana
The IoT platform supports two Grafana data sources:
- JSON data source (simpod-json-datasource) - host your own Grafana and view time-series data from the platform.
- Infinity data source - use any of the IoT platform's REST API endpoints to build tables, charts and maps, and drive Grafana's alert manager.
This guide shows how to build panels. To install and connect Grafana first, see Grafana Setup. If you don't have access to Grafana from your platform account, ask an admin to grant it or contact your technical support.
Which data source should I use?
| Use the… | when you want to… |
|---|---|
| JSON data source | quickly graph a device's values or plot devices on a map (device selected as a "metric") |
| Infinity data source | pull any REST API response into a table, build charts/maps from arbitrary endpoints, or set up alerting |
Field names are the IoT platform's canonical fields (
temperature,rssi,lnglat, …), so a panel built for one device works for others of the same kind.
Build panels with the JSON data source
Time-series graph
- Choose Time series as the visualization (top-right).
- Choose the metric (the IoT node / device) you want to graph.
- Choosing the wildcard metric (
*) graphs values from all your active devices.
Hide lat / lng from a graph
If a device has an lnglat field, its lat and lng show up on the time-series
graph. To hide them:
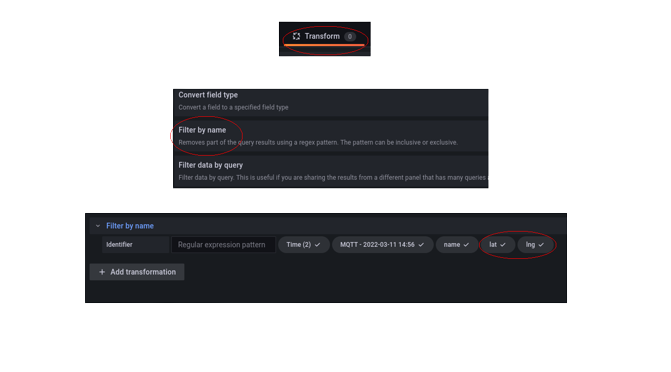
- Make sure a metric (device) is selected.
- Click Transform.
- Choose Filter by name.
- Uncheck
latandlng.
Map (Geomap)
- Choose Geomap as the visualization (top-right).
- Choose the metric (device) to plot.
- Make sure
latandlngare checked (opposite of the previous step). - Choosing the wildcard metric (
*) plots all your active devices' GPS positions - after selecting the Merge option under Transform.
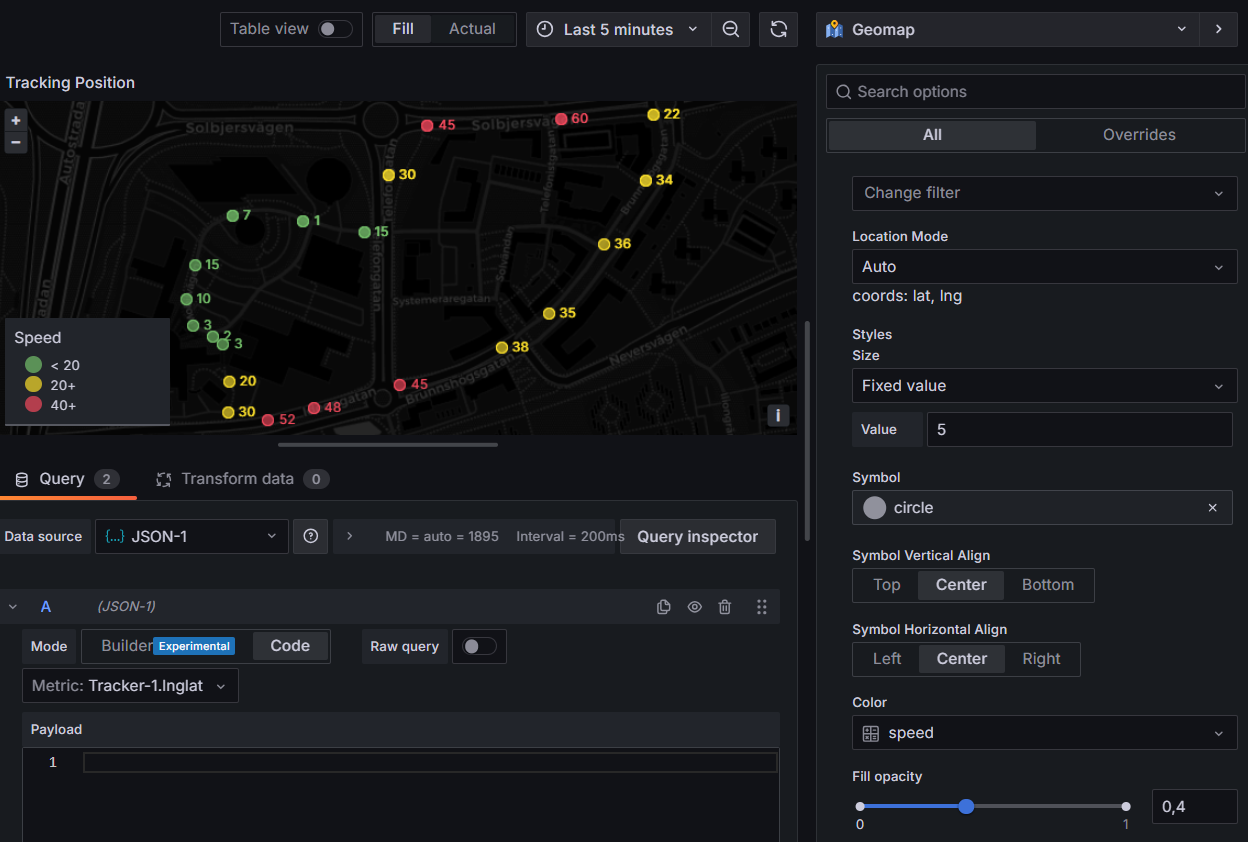
Tracker location history
- Choose Geomap as the visualization (top-right).
- Choose the metric
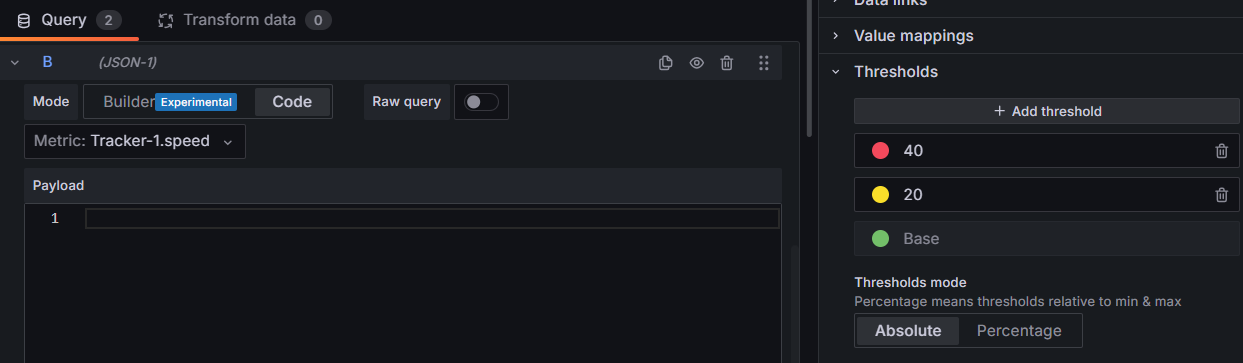
Your Tracker.lnglat- this draws the track on the map automatically. - Optionally add a second query,
Your Tracker.speed, to colour-code the track. - In the Marker side panel, select the value to colour-code by and set the thresholds.
Build panels with the Infinity data source
The Infinity data source calls the IoT platform's REST API directly. The easiest way to
learn it: copy a complete request URL from Swagger (https://staging.yggio.net/swagger),
paste it into the panel, then add columns using the field names from the JSON
response (visible in Swagger) and set each column's data type. Click refresh to
try it.
Table
- Choose Table as the visualization (top-right).
- Enter the
GETURLhttps://staging.yggio.net/api/iotnodes. To filter, add aqquery - e.g.https://staging.yggio.net/api/iotnodes?q=temperaturereturns only devices that have atemperaturefield. - Under Parsing options & Result fields, enter the columns you want, e.g.:
nameas Name, typeStringreportedAtas Reported, typeTimerssias RSSI, typeNumbersnras SNR, typeNumber
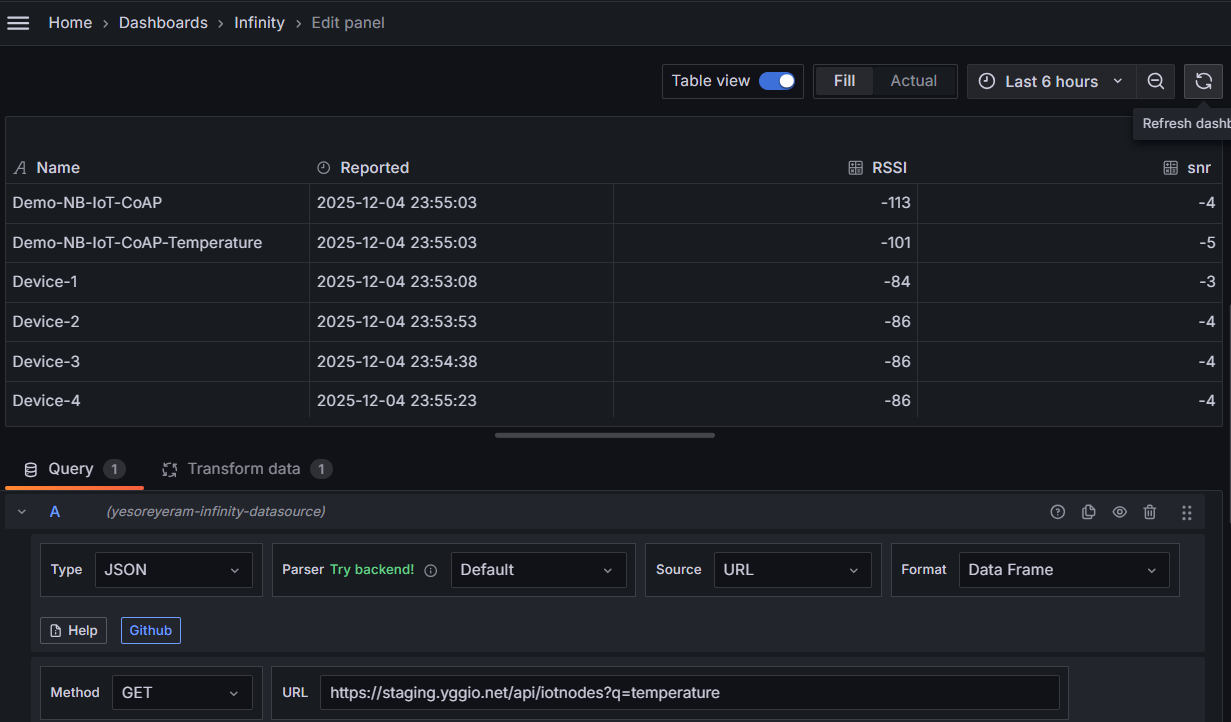
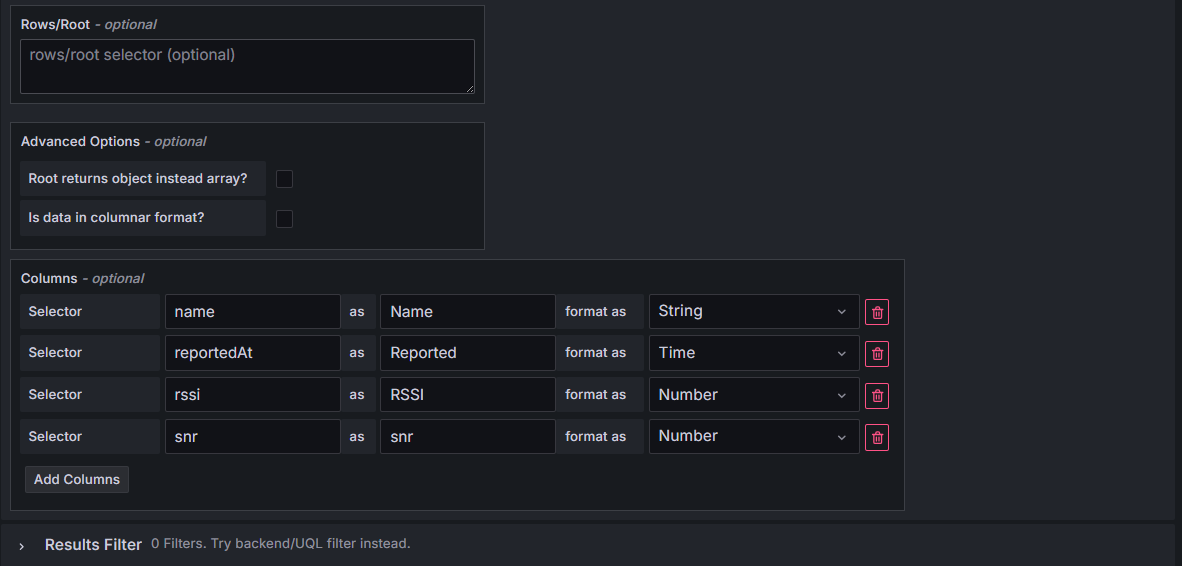
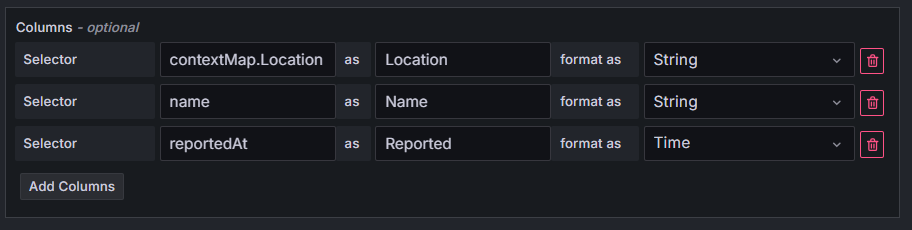
To include contextual parameters, add selector columns like
contextMap.yourFieldName:
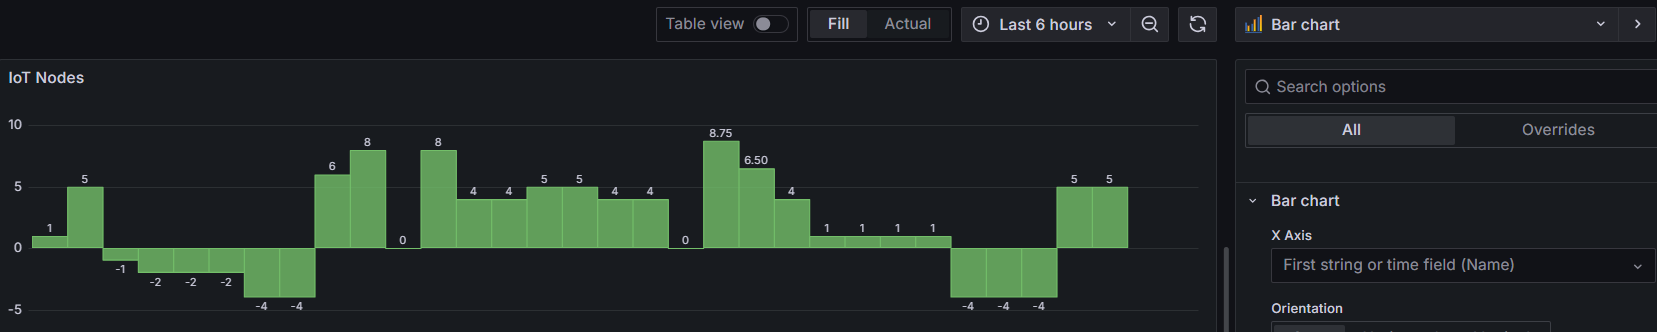
To show the same data as a bar chart, just change the panel type to Bar chart:
Time series
- Choose Time series as the visualization (top-right).
- Enter the
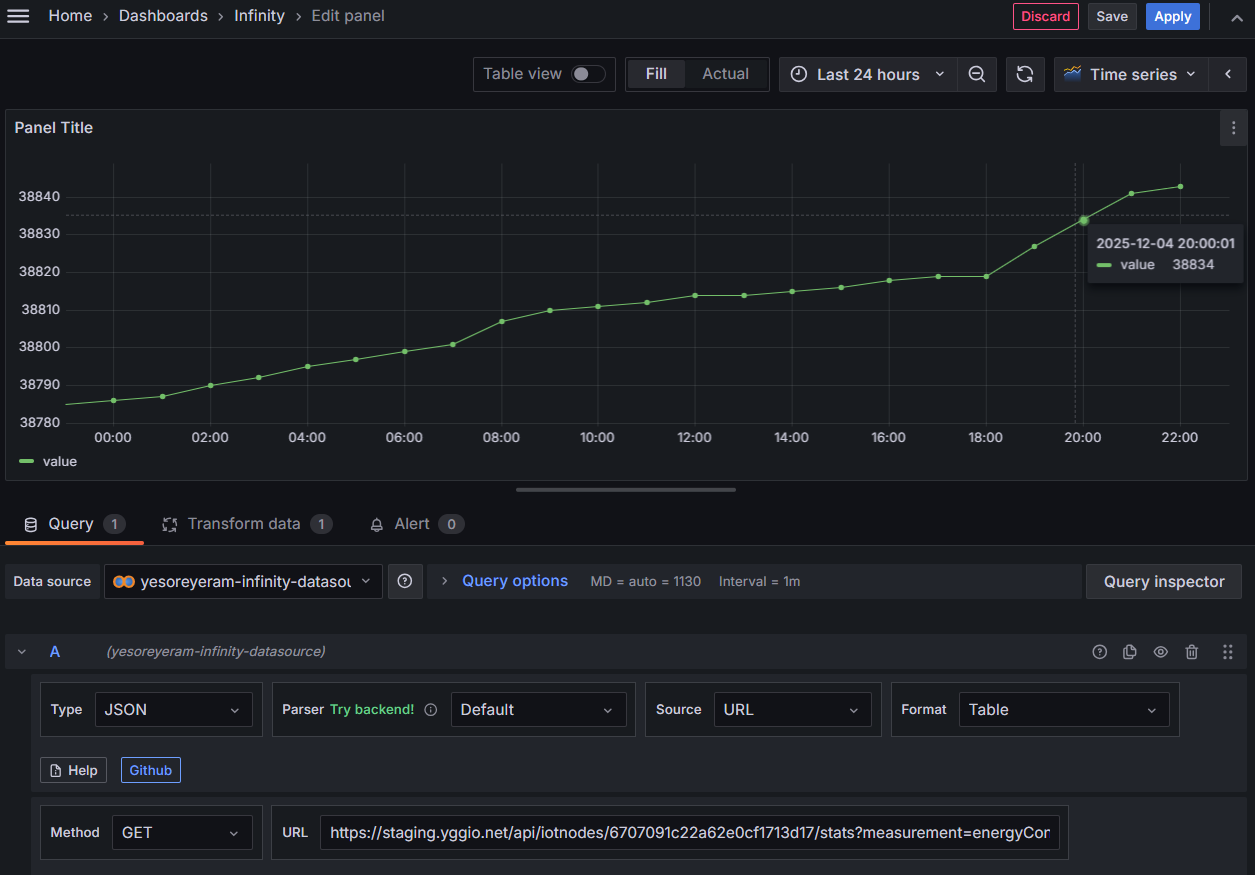
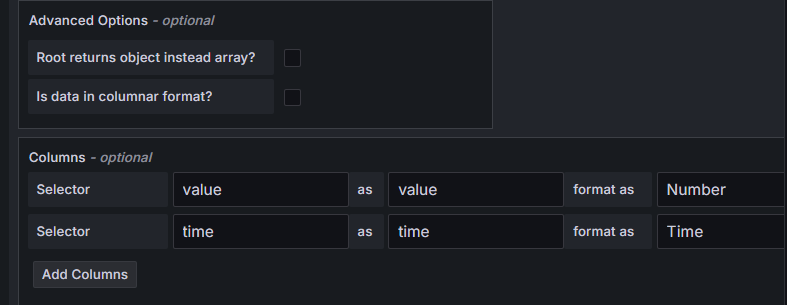
GETURLhttps://staging.yggio.net/api/iotnodes/<device _id>/stats?measurement=temperature&start=<start time in unix ms>&distance=3600to get thetemperaturetime series (distanceis the bucket size in seconds). - Under Parsing options & Result fields, map the columns:
valueas value, typeNumbertimeas time, typeTime
Map (Geomap)
- Choose Geomap as the visualization (top-right).
- Enter the
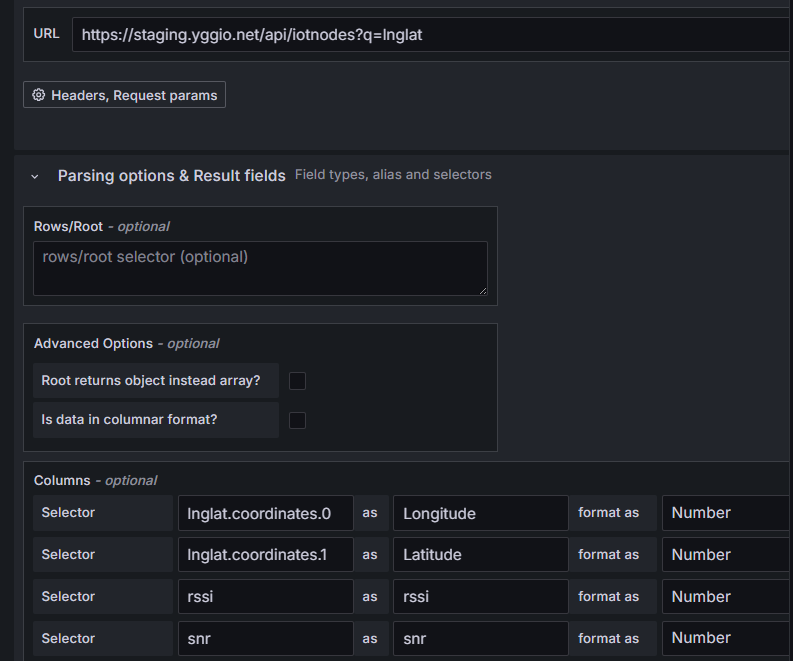
GETURLhttps://staging.yggio.net/api/iotnodes?q=lnglatto get devices that have a valid location. - Under Parsing options & Result fields, map the location and the values to
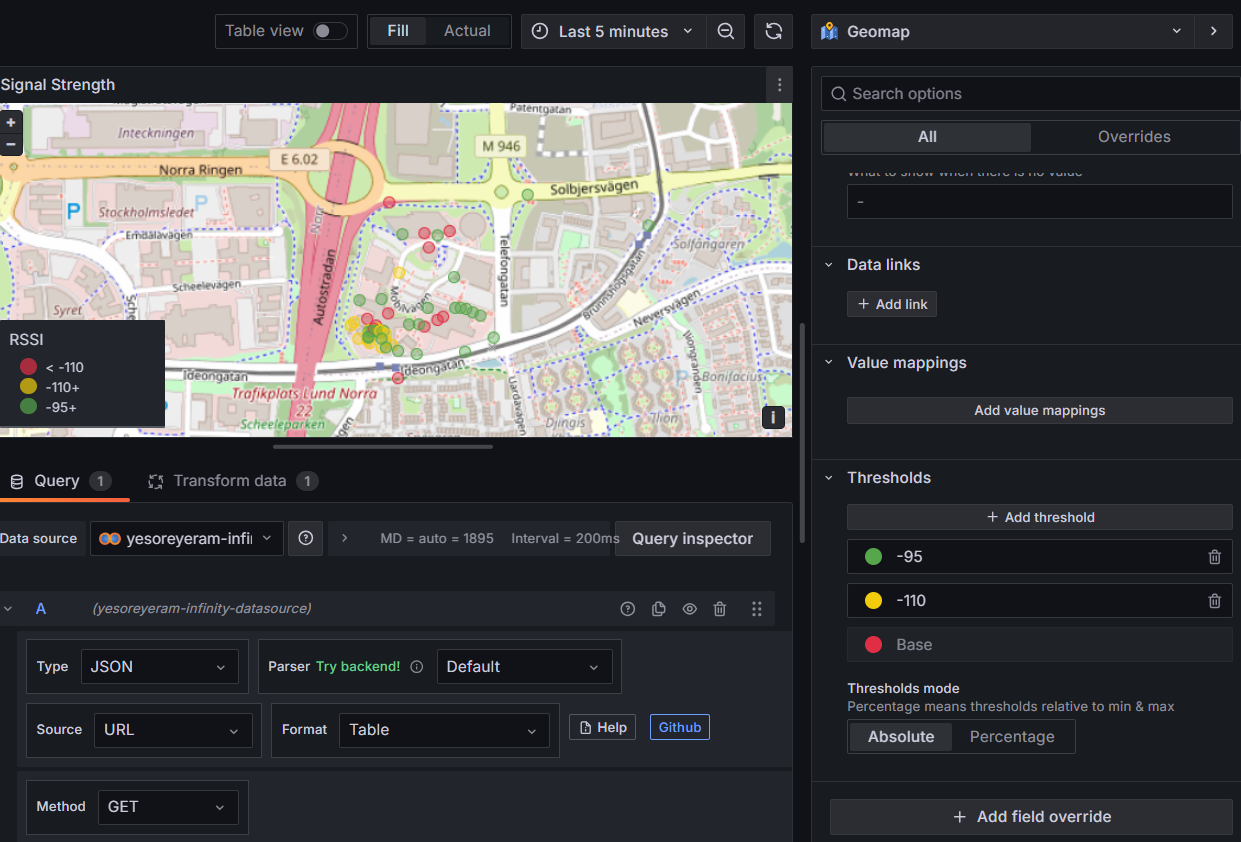
plot - e.g. for a signal-strength map:
lnglat.coordinates.0as Longitude, typeNumberlnglat.coordinates.1as Latitude, typeNumberrssias RSSI, typeNumbersnras SNR, typeNumber
- Add thresholds to colour-code the map.
Choosing a panel type
Grafana has many visualizations. For the IoT platform's data, these are the common choices:
| To show… | Use | Notes |
|---|---|---|
| A value trending over time (temperature, energy, humidity) | Time series | the default for metrics |
| The latest single value, big and bold (current temp, battery %) | Stat | add thresholds to colour it; shows a sparkline |
| A value within a known range (battery %, tank fill, humidity) | Gauge | set min/max and thresholds |
| The same value across many devices (battery of every sensor) | Bar gauge | one bar per device - wildcard metric * + a Reduce transform |
| A list of devices and their fields | Table | Infinity → /api/iotnodes |
| Device locations, tracker paths, heatmaps | Geomap | needs lnglat (lat/lng) |
| A boolean / on-off state over time (occupancy, door, alarm) | State timeline | ideal for presence, contact, *Alarm fields |
| Counts or categories side by side (people per zone) | Bar chart | |
| The distribution/spread of a measurement | Histogram | |
| Current alerts | Alert list | pairs with Infinity alert rules |
Tips & techniques
- Set the unit (Panel → Standard options → Unit, e.g. Celsius (°C), Percent (0-100), Volts) so axes, tooltips and Stat/Gauge render correctly.
- Thresholds (Panel → Thresholds) colour Stat / Gauge / Time series by value - e.g. temperature turns red above 30 °C, battery amber below 20 %.
- Value mappings (Panel → Value mappings) turn numbers into words - map
0 → Closed/1 → Open, orfalse → Vacant/true → Occupiedfor boolean fields likecontactorpresence. - Transformations do most of the shaping without changing the query:
- Filter by name - hide fields such as
lat/lng. - Merge - combine wildcard (
*) results into one series or table. - Organize fields - rename, reorder and hide columns.
- Reduce - collapse a time series to its last / max / mean (feeds a Stat or Bar gauge).
- Add field from calculation - derived columns (difference, ratio, etc.).
- Filter by name - hide fields such as
- Device dropdown (dashboard variables): in Dashboard settings → Variables create a variable of device names, then reference it in your queries so one dashboard serves any device. Combine with Repeat (Panel → Repeat options) to auto-generate one panel per selected device.
- Navigation between dashboards: link dashboards together to build a
landing-page → drill-down experience. Options, simplest first:
- Text panel - plain Markdown links to other dashboards.
- Dashboard list panel - auto-lists dashboards by tag or folder, no config.
- Data links / panel links - click a series or panel to jump to another dashboard, carrying the current variables (e.g. the selected device).
- Business Text panel (Volkov Labs, community plugin
marcusolsson-dynamictext-panel) - the powerful option: render custom Markdown/HTML from your query data, so you can build a data-driven navigation menu (e.g. one link per device, generated from a device list, each passing that device into the target dashboard's variables). Install it first:grafana-cli plugins install marcusolsson-dynamictext-panel, then restart.
- Auto-refresh & time range: set the dashboard refresh (e.g. every 1 m) and a sensible default range (top-right) - Last 24 hours is a good start.
- Legend values: show last / mean / max in the legend (Panel → Legend) for quick at-a-glance numbers.
- Alerting (Infinity only): you can alert on any REST value - thresholds, or offline devices via No data - see Set up a simple alert.
- Public dashboards (embed in a website, no login): a public dashboard runs queries with no logged-in user, so it can't query the IoT platform directly - the data must first be copied into your own store. See Publish on a public dashboard.
Common recipes
End-to-end examples that combine the steps above - copy the settings.
Current temperature, colour-coded (Stat)
- New panel → Stat. JSON data source → pick the device → field
temperature. - Standard options → Unit = Celsius (°C).
- Thresholds: base green, add red at
30, blue at0. → A big current-temperature number that turns red when it's hot.
Battery level of every sensor (Bar gauge)
- New panel → Bar gauge. JSON data source → metric
*→ fieldbatteryLevel. - Transform → Reduce = Last (one value per device).
- Unit = Percent (0-100); Thresholds: red
<20, amber<50, else green. → One bar per sensor - instantly shows which batteries are low.
Occupancy over time (State timeline)
- New panel → State timeline. Pick the device → field
presence(oroccupied). - Value mappings:
true → Occupied,false → Vacant(give each a colour). → A coloured ribbon showing when the space was occupied.
Alert when a device goes offline - set up an Infinity alert rule (see Set up a simple alert) and use its No data → Alerting option, so you're notified when a sensor stops reporting.
Fleet overview table (Table via Infinity)
- New panel → Table. Infinity data source →
GET https://staging.yggio.net/api/iotnodes(add?q=batteryLevelto limit it to your sensors). - Parsing options & Result fields - add the columns:
nameas Device, typeStringbatteryLevelas Battery %, typeNumberrssias RSSI, typeNumbersnras SNR, typeNumberreportedAtas Last reported, typeTime
- Colour the battery column: add a field override on Battery % →
Cell display mode = Colored background, with Thresholds red
<20, amber<50, else green. - Surface silent devices: sort the table by Last reported (click the column header, or set it as the default sort) so the least-recently-seen devices rise to the top. → One row per device showing battery, signal and last-seen - an at-a-glance fleet-health view.
Energy consumption per day (Bar chart)
- Run the
calculate-energy-consumption-per-time-periodtranslator on the meter- it turns the cumulative
activeEnergyImportreading intoenergyConsumptionDay/Week/Month(each resets at local midnight). See Translator Development.
- it turns the cumulative
- New panel → Bar chart (or Time series). JSON data source → pick the meter →
field
energyConsumptionDay. - Unit = kWh (kilowatt-hour); optionally add thresholds to flag high-usage days. → Each day's consumption; the value just before midnight is that day's total.
No translator on the meter? Query the raw cumulative reading per day via
Infinity - /stats?measurement=activeEnergyImport&distance=86400 - then take the
day-over-day difference in Grafana. The IoT platform's /stats buckets by distance but
doesn't difference server-side, so the translator route above is simpler.
Set up a simple alert (Infinity)
Grafana can alert on any of the IoT platform's REST data through the Infinity data source. Here is a minimal threshold alert - "notify me when a temperature goes above 30 °C" - using Grafana's unified alerting (Grafana 9+).
- Create a contact point (once): Alerting → Contact points → Add contact point. Choose a type (email, Slack, webhook, …), fill in the details, and test it.
- New alert rule: Alerting → Alert rules → New alert rule, and name it.
- Query the value (query
A): choose the Infinity data source and enter aGETURL that returns the number to watch, e.g.https://staging.yggio.net/api/iotnodes/<device _id>/stats?measurement=temperature&start=<ms>&distance=3600(parsevalueas aNumber). Run it to confirm it returns data. - Reduce to one value (expression
B): add a Reduce expression, function Last, inputA. Alert rules evaluate a single number, not a whole series. - Set the threshold (expression
C): add a Threshold expression onB, e.g. IS ABOVE30, and setCas the alert condition. - Evaluation: put the rule in an evaluation group with an interval (e.g. every 1 m) and a pending period (e.g. 5 m) so a brief spike doesn't fire immediately.
- Notifications: add a summary annotation (the message you'll receive), then make sure the rule's labels match a notification policy that routes to your contact point (the default policy routes everything to the default contact point, which is the simplest start).
- Save. When the temperature stays above 30 °C for the pending period you get a notification; it resolves automatically when the value drops back.
Offline-device alerts: in the rule's Configure no data and error handling, set the state to Alerting when the query returns No data. Paired with a query that only returns recent data, this notifies you when a device stops reporting.
Publish on a public dashboard
You can put a dashboard on a public URL and embed it in a website so anyone can see it without logging in - for live air quality, water levels, parking occupancy, and the like.
The one thing to understand first
A public dashboard runs its queries server-side, with no logged-in user. The IoT platform, by design, never returns data without authorization, so a public (userless) dashboard cannot query the IoT platform directly - the JSON and Infinity data sources above rely on your being logged in, which a public viewer is not.
So the data has to already be sitting in a store Grafana can read without a login to the IoT platform. The pattern: copy the live data out of the IoT platform into your own InfluxDB, and point the public dashboard at InfluxDB. A small Node-RED flow does the copying - and because it authenticates to the IoT platform's MQTT broker with a Basic Credential Set (a durable username/password, not a user session), it runs unattended. The public viewer never touches the platform.
Yggio MQTT output ──(Basic Credential Set)──▶ Node-RED ──▶ InfluxDB ──▶ public dashboard ──▶ iframe
     durable auth              bridge flow                 no Yggio auth in the public path
Many teams already run Node-RED, so this usually reuses infrastructure you have.
Prerequisites
- A Node-RED install that can reach the IoT platform's MQTT broker (Node-RED guide).
- An InfluxDB instance (a single Docker container is fine - Step 1).
- A self-hosted Grafana reachable from the internet (reverse proxy + HTTPS).
- In the IoT platform: a Basic Credential Set and an MQTT channel on each device you want to publish (MQTT reference).
Step 1 - Stand up InfluxDB
If you don't already have one:
docker run -d --name influxdb -p 8086:8086 \
  -v influxdb-data:/var/lib/influxdb2 \
  influxdb:2
Open http://<host>:8086, run the setup wizard, and note four things you'll
reuse: the URL, the organization, an API token, and a bucket name (e.g.
yggio-public). Use a separate bucket per customer so each public dashboard only
ever exposes its own devices.
Step 2 - Build the Node-RED bridge
-
Install the InfluxDB nodes: Manage palette → Install →
node-red-contrib-influxdb. -
MQTT in node - add an MQTT server for the IoT platform's broker:
- Server
mqtt.staging.yggio.net, Port8883, TLS enabled. - Security: the Basic Credential Set username/password.
- Topic: the topic from the device's MQTT channel in the IoT platform (device → Channels tab → basicCredentialSet channel → copy the topic). See the MQTT reference.
- Set Output to "a parsed JSON object" so
msg.payloadis an object.
- Server
-
Function node - turn the reading into an InfluxDB point, keeping only the devices you intend to publish:
// Only these devices are allowed onto the public dashboard.const PUBLIC = ['device-id-1', 'device-id-2'];const deviceId = msg.topic.split('/').pop(); // or read from msg.payloadif (!PUBLIC.includes(deviceId)) { return null; } // drop everything else// Keep numeric canonical fields only (temperature, batteryLevel, ...).const fields = {};for (const [k, v] of Object.entries(msg.payload)) {if (typeof v === 'number') { fields[k] = v; }}if (Object.keys(fields).length === 0) { return null; }msg.payload = [fields, {deviceId}]; // node-red-contrib-influxdb: [fields, tags]return msg; -
InfluxDB out node - select your InfluxDB server (URL, token, org), set the bucket and a measurement name (e.g.
reading). -
Deploy. Readings now flow into InfluxDB.
Don't lose data if InfluxDB blips. The bridge is the one spot Node-RED doesn't buffer for you. For resilience, batch writes and add a small retry (a
catchnode feeding a retry path). For a few devices at a slow report rate this rarely matters - size it to your fleet.
Step 3 - Add InfluxDB as a Grafana data source
Pure UI, no plugin to install (InfluxDB is built into Grafana): go to
Connections → Data sources → Add data source → InfluxDB, then set the query
language (Flux for InfluxDB 2), the URL http://<influx-host>:8086, and the auth
(token, organization, default bucket). Click Save & test.
Step 4 - Build the dashboard
Add panels querying InfluxDB. A minimal Flux query for one field:
from(bucket: "yggio-public")
  |> range(start: v.timeRangeStart, stop: v.timeRangeStop)
  |> filter(fn: (r) => r._measurement == "reading" and r._field == "temperature")
Set the dashboard auto-refresh (e.g. 10 s) for a live feel.
Step 5 - Make the dashboard public
On self-hosted (community) Grafana, add to grafana.ini:
[security]
allow_embedding = true

# Only on older Grafana (9.x / 10.0–10.1); ~10.2+ has it on by default.
[feature_toggles]
publicDashboards = true
Restart Grafana, then on the dashboard choose Share → Public dashboard → enable and copy the public URL. (In Grafana 11/12 this is under Share → External / Shared dashboard - same feature, renamed.)
Step 6 - Embed it in the website
Drop the public URL into an <iframe> in the site's CMS:
<iframe src="https://GRAFANA_HOST/public-dashboards/<token>"
        width="100%" height="600" frameborder="0"></iframe>
Security, isolation and limits
- Exposure: a public dashboard shows everything in its bucket to anyone with
the link - there is no per-viewer filtering. Keep each customer's data in its
own bucket, and only let the bridge write the devices in the
PUBLICallow-list. - Credentials: the bridge's Basic Credential Set is a real credential for the IoT platform - protect the Node-RED instance (keep it behind a firewall; it has only a simple login).
- Feature limits: public dashboards don't support template variables, some panel types are unavailable, and results are cached - fine for fixed "current readings + recent trend" displays, less so for interactive exploration.
- Latency: "real-time" is driven by the refresh interval plus that cache, not sub-second streaming; InfluxDB ingest itself is fast.
- History: InfluxDB only holds data from when the bridge starts. To backfill,
do a one-time load from the IoT platform's
/statsendpoint (see Accessing the IoT platform's API).