Swimlane
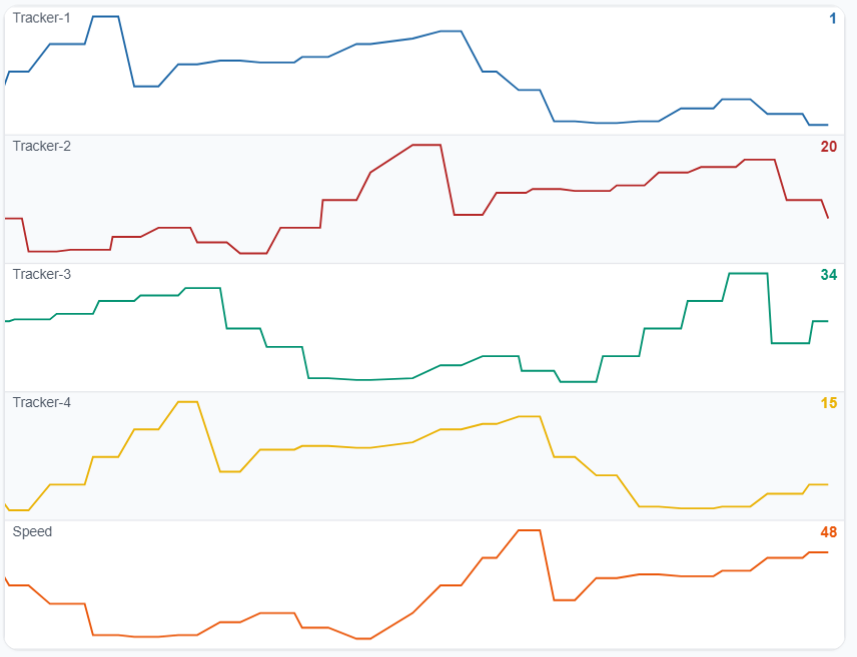
The Swimlane widget streams live values across independent lanes, one lane per signal, scrolling right to left. Each lane has its own vertical scale, so a value that moves a little and a value that moves a lot are both readable side by side.
Use it to watch many sensors at once and catch a spike as it happens. It is a live view, not a history: values scroll off the left edge and are not kept.
For plotting history rather than watching it arrive, use the Multi-device chart instead.
Setup
A signal is one device plus one field. The widget needs at least one.
- Under Devices, select the devices to add.
- Pick the field. The field list comes from the first device you selected, and the field you choose is applied to every device in the selection.
- Press Add signals. Devices that already have that signal are skipped, and the widget says how many.
- Repeat for each field you want. A device can appear in several lanes, one per field.
The Signals list below shows what the widget will draw. Press the pencil on a row to edit it, or the cross to remove it.
| Per-signal setting | What it does |
|---|---|
| Label | The lane's name. Defaults to the field name |
| Unit | The unit shown after the value |
| Base color | The colour of the lane's trace |
Options
| Setting | What it does |
|---|---|
| Window | How much time is visible before values scroll off the left: 30 seconds, 1 minute, 2 minutes, 5 minutes or 10 minutes. The default is 1 minute |
| Show value | Whether the current number is printed on each lane |
| Heading | An optional heading for the widget. The toggle beside it shows or hides the heading |
The widget polls for new values every 15 seconds, so a shorter window scrolls in larger steps rather than more smoothly. It keeps at most 600 samples per lane in memory, whatever the window.