Multi-Device Chart
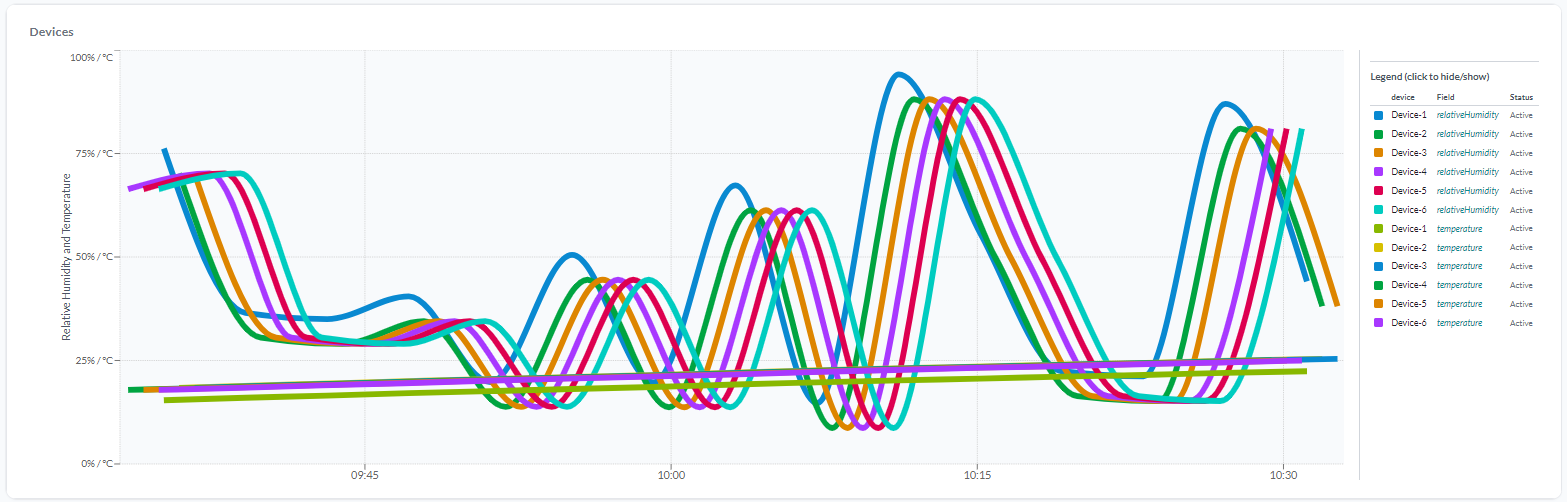
The Multi-Device Chart widget displays time series data from multiple devices and fields. For charts limited to a single device and field, see Device Chart.
Setup
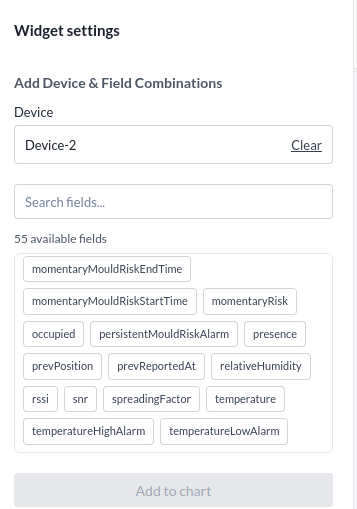
- Select the Device from the list.
- Select the Field, the data field to chart.
- Press Add to Chart to add the device-field combination.
- Repeat for every combination you want on the chart.
The Selected Combinations section lists the added device-field combinations. Press Delete to remove an individual field or an entire device from the chart.
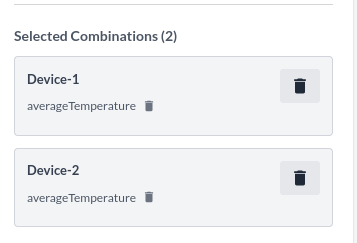
Chart type
This widget can draw the series in four ways. The setting is not available on the single Device chart.
| Chart type | Suits |
|---|---|
| Line | A value that moves continuously, such as a temperature |
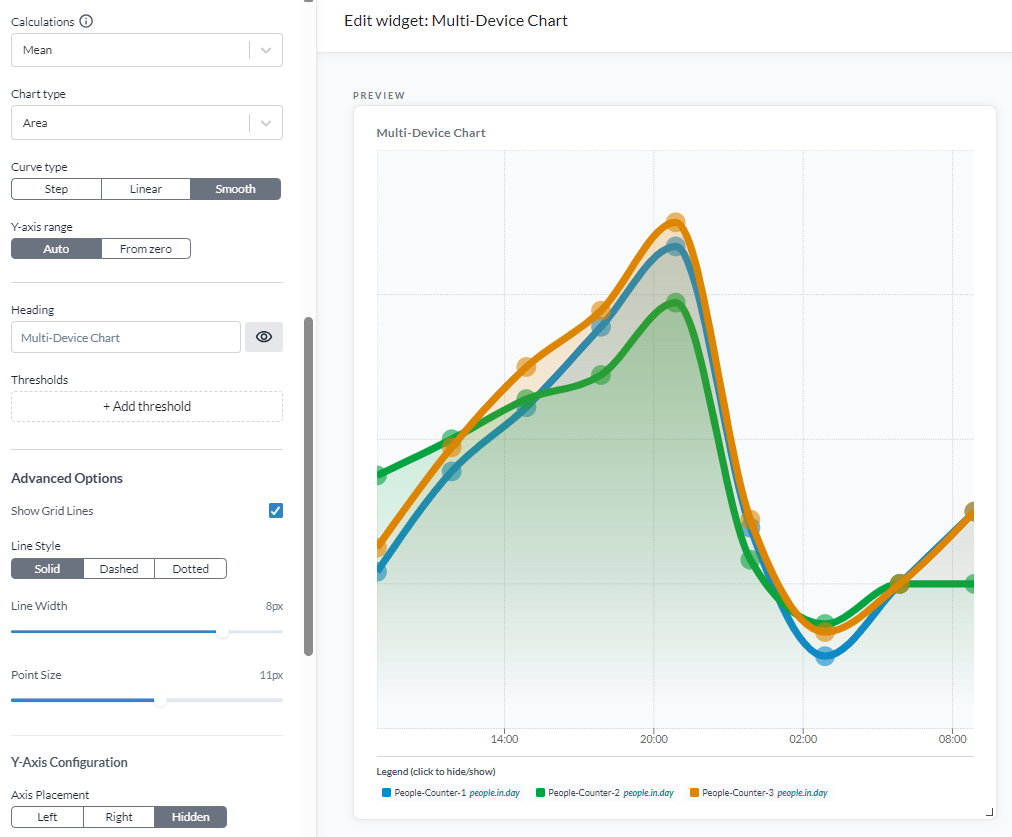
| Area | The same, with the area under the line filled |
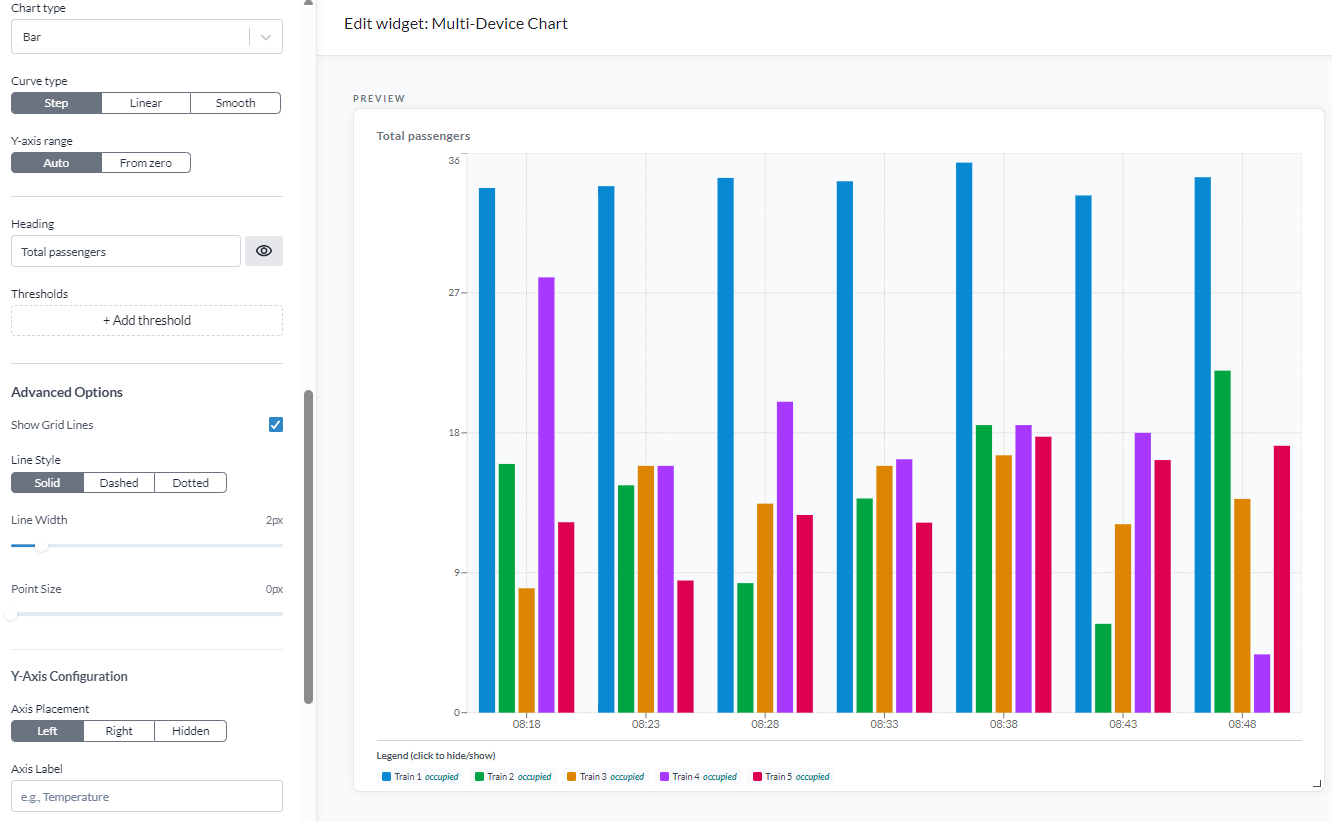
| Bar | A value measured per interval, such as consumption or a count |
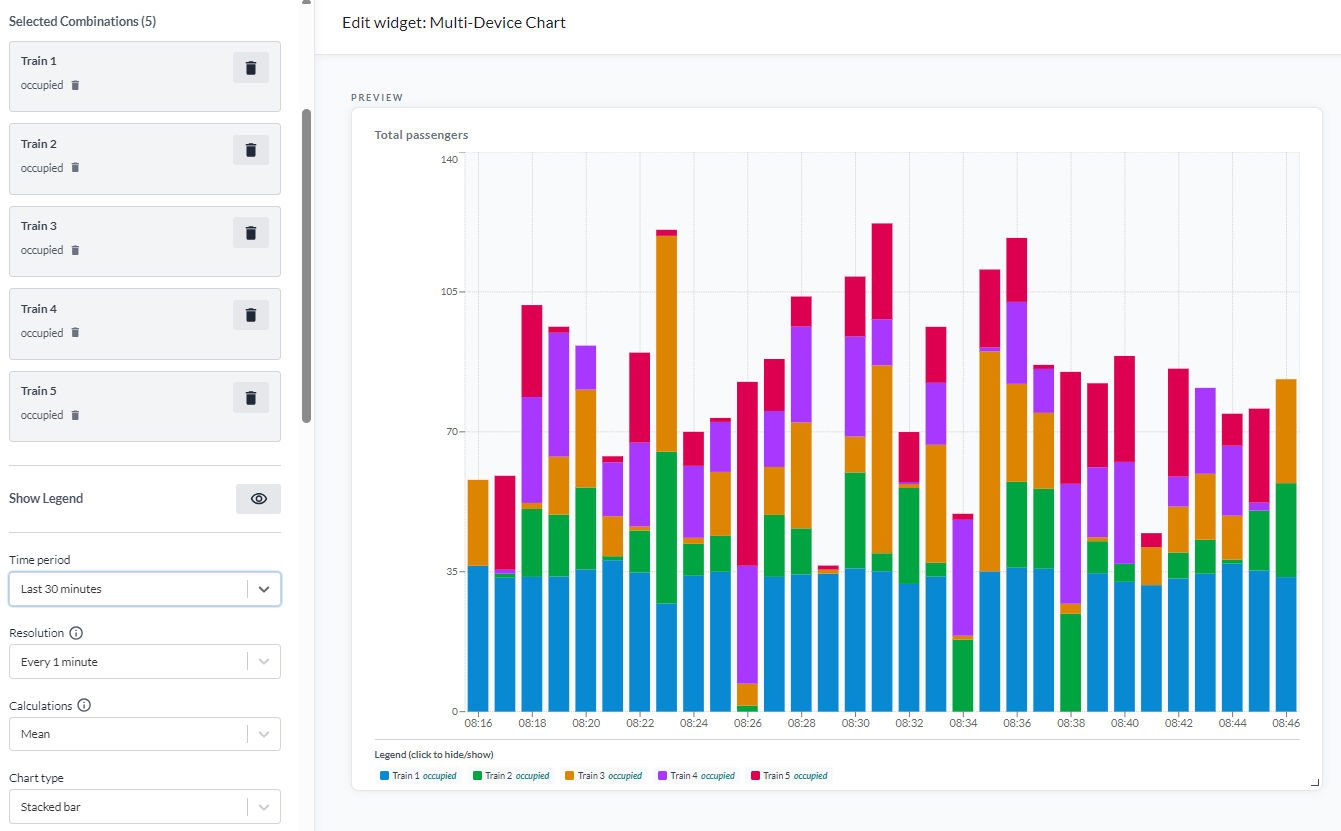
| Stacked bar | The same, with the series on top of each other |
With Stacked bar, each bar is the total across the devices and each segment is one device's part of it. It answers "how much altogether, and who contributed what" in one chart - the same question a pie chart answers for a single moment.
Stacking only means something where the values add up. Stacked temperatures do not.
Three of the four, each shown with the Chart type setting that produced it:
Shared settings
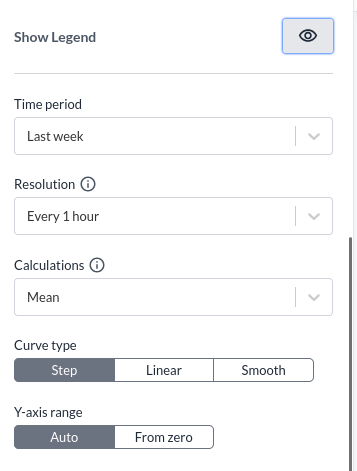
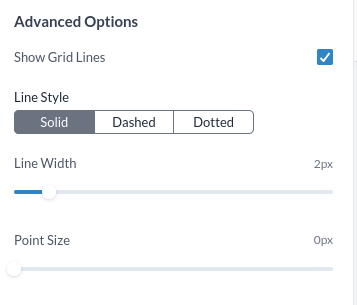
The following settings are shared with the Device Chart widget. See Device Chart for descriptions.

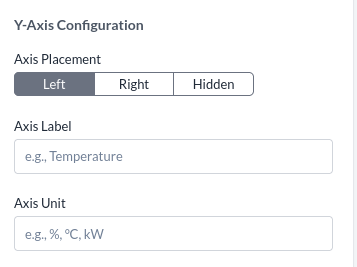
Legend configuration
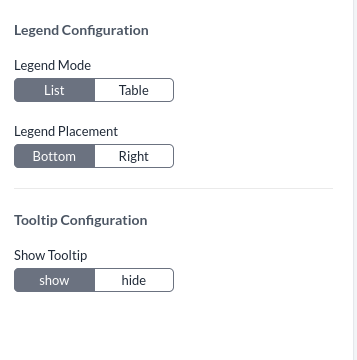
- Legend Mode is list or table.
- Legend Placement is bottom or right.
Tooltip configuration
The tooltip displays device field values on hover. The tooltip can be shown or hidden.