Equalizer
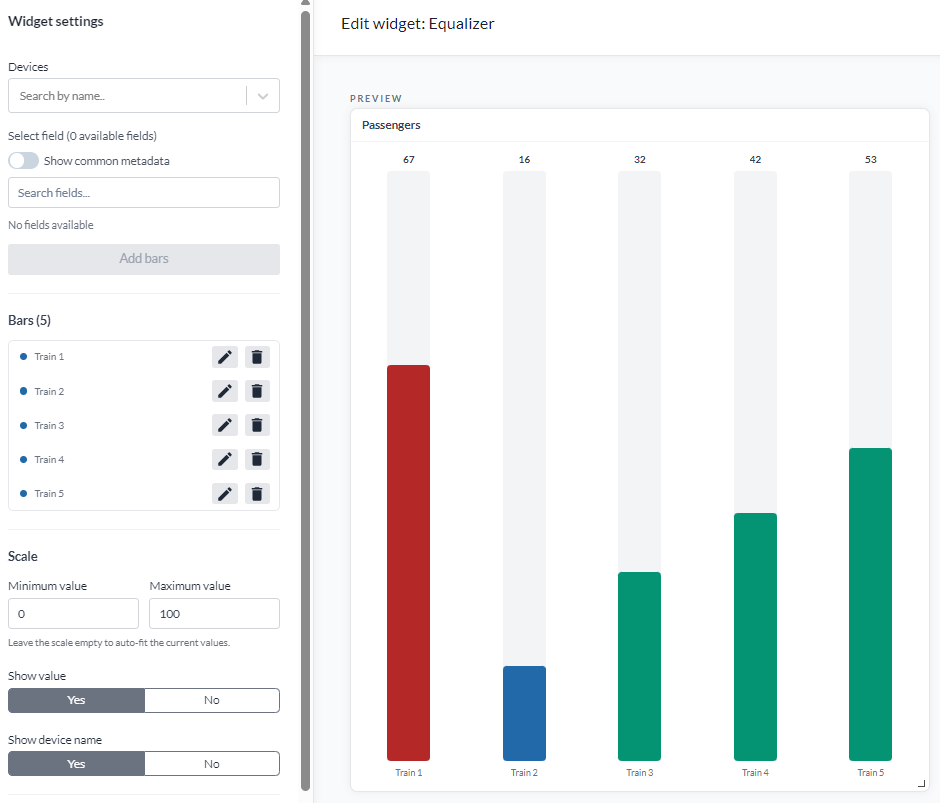
The Equalizer widget shows current values from several devices as vertical bars, side by side. All bars share one scale, so the comparison between them is the point: which room is warmest, which meter is drawing most, which sensor is the outlier.
It shows the latest value only. For the same values over time, use the Multi-device chart; for a grid of numbers rather than bars, use Multi-device value.
Setup
A bar is one device plus one field. The widget needs at least one.
- Under Devices, select the devices to add.
- Pick the field. The field list comes from the first device you selected, and the field you choose is applied to every device in the selection.
- Press Add bars. Devices that already have that bar are skipped, and the widget says how many.
The Bars list below shows what the widget will draw. Press the pencil on a row to edit it, or the cross to remove it.
| Per-bar setting | What it does |
|---|---|
| Label | The bar's name. Defaults to the field name |
| Unit | The unit shown after the value |
| Base color | The bar's colour when no threshold applies |
| Thresholds | Colour rules based on the value, so a bar that has gone out of range stands out |
Display settings
| Setting | What it does |
|---|---|
| Scale: Min value / Max value | The bottom and top of the shared scale. Leave either empty to auto-fit that end to the current values |
| Show value | Whether the number is printed on each bar |
| Show device name | Whether the device name is printed under each bar |
| Heading | An optional heading for the widget. The toggle beside it shows or hides the heading |
Pin the scale when you are comparing against a fixed expectation - a room that should be 20 °C to 23 °C. Leave it on Auto when you only care about which bar is highest, since auto-fit rescales as the values move and keeps the differences visible.
Values refresh every 30 seconds.