Device Value
The Device Value widget shows the current value of one field from one device, in large type. It is the widget for the number somebody wants to see from across the room.
Four display types are available, and colour thresholds change the colour according to the value. For several devices at once, use Multi-device value; for the same value over time, use Device chart.
Display types
| Type | Suits |
|---|---|
| Text | Any value. The only type with a sparkline |
| Circle | A value with a known minimum and maximum, shown as a filled ring |
| Bar | The same, shown as a bar |
| Gauge | The same, with thresholds as coloured segments on the arc |
Circle, Bar and Gauge need a minimum and a maximum to fill against, so they suit a value with real limits - a battery percentage, a tank level. Text suits a value with no natural ceiling.
Common parameters
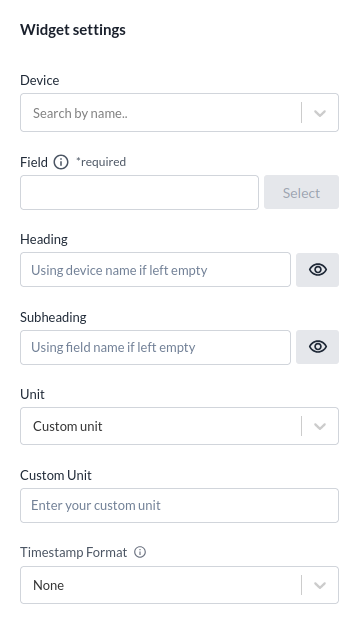
- Device is the source of the data.
- Field is the field to show.
- Heading defaults to the device name if left empty.
- Subheading defaults to the field name if left empty.
- Unit is taken from a list. If the unit you need is not there, enter a custom one.
- Timestamp format is None, Relative (for example "2h ago"), ISO 8601, Local, Date only, Time only, or Date and time.
- Base color is the colour used when no threshold applies.
Every type also allows the value, heading and subheading font sizes to be set.
Text
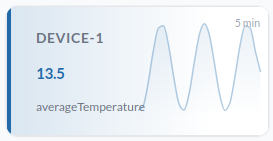
The value as text.
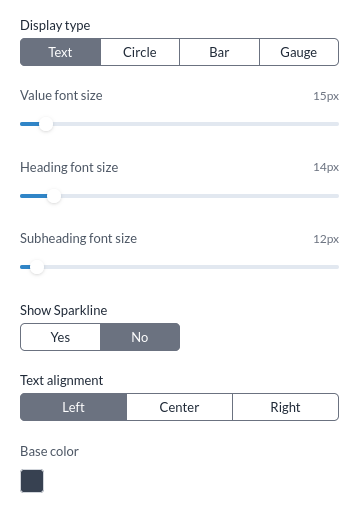
The sparkline is only available on this type. It gives a small overview of how the value has moved over the last 1 h, 6 h, 24 h or 7 d, which is often enough to tell a steady value from a drifting one without opening a chart.
Circle
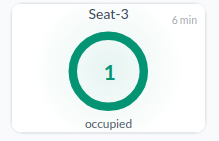
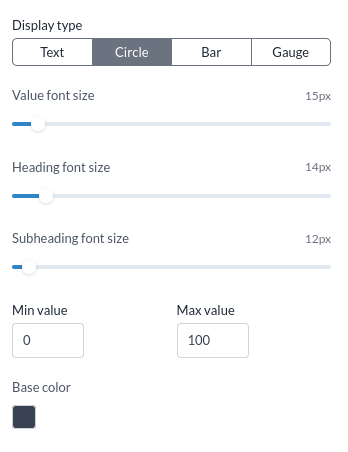
- Min value is the smallest value the ring represents.
- Max value is the largest. If the value goes above it, only the number keeps changing - the ring stays full.
Bar

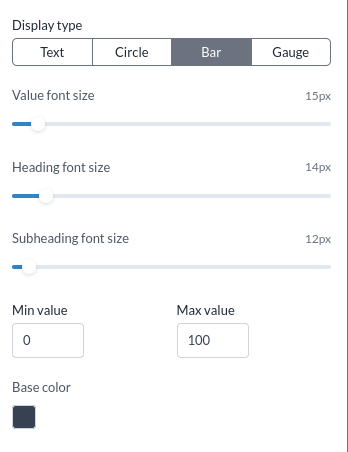
Works like Circle, drawn as a bar.
Gauge
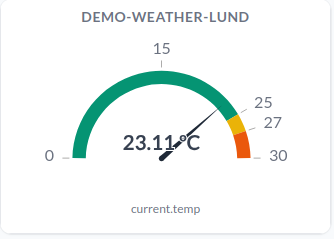
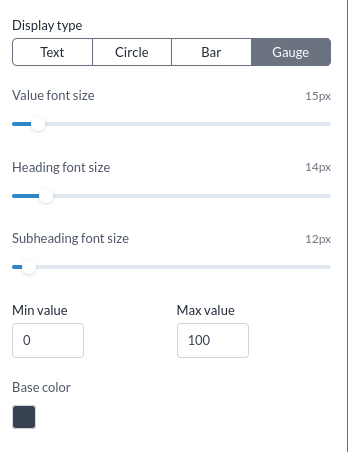
Works like Circle, with two differences: the thresholds are drawn as coloured segments along the arc, and an arrow points at the current value. It is the type that shows where a value sits relative to its limits, not just what it is.