Device Chart
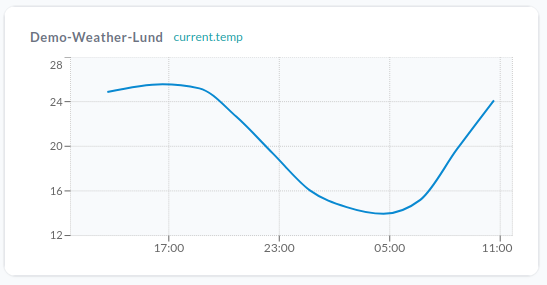
The Device Chart widget displays time series data for a single field from a single device. To chart multiple devices or fields, use the Multi-Device Chart widget.
Setup
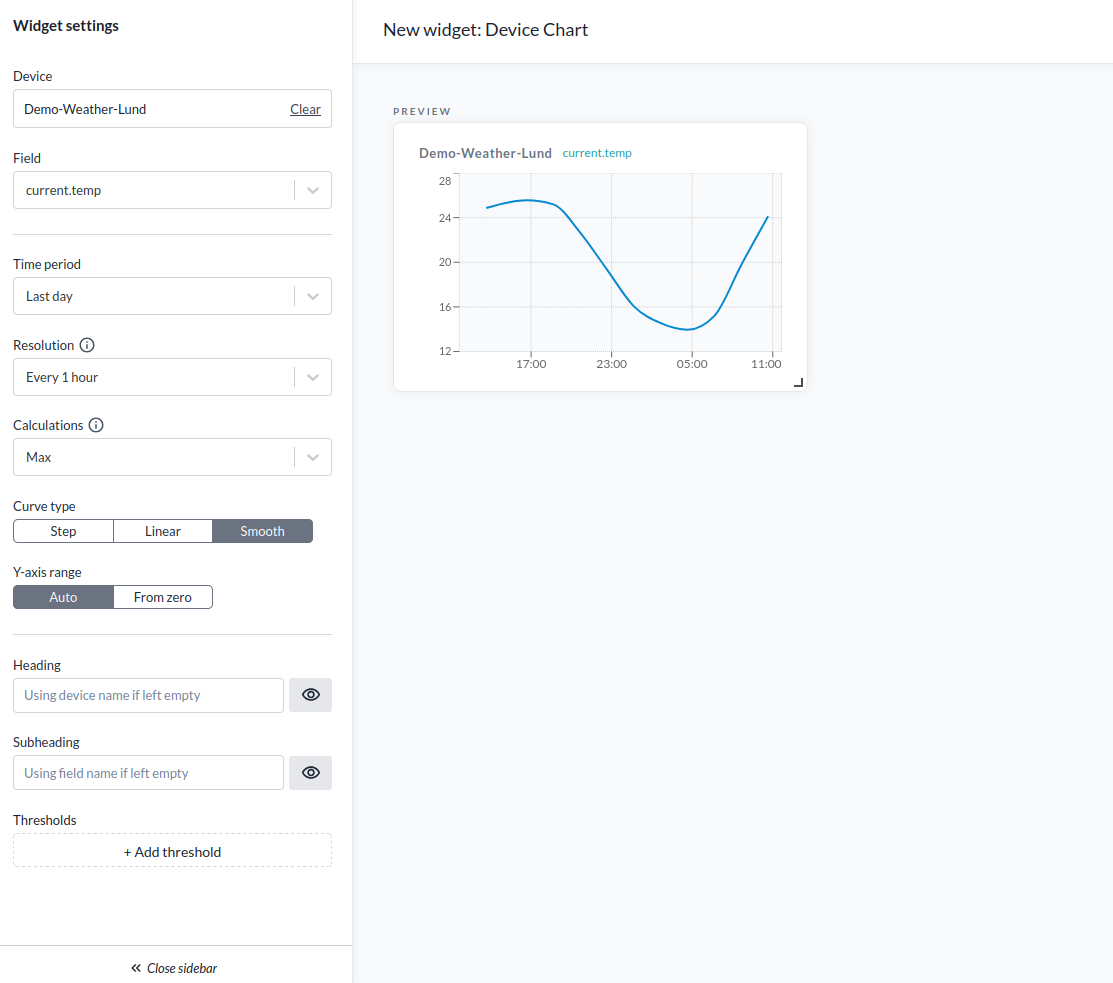
- Device sets the device the data comes from.
- Field sets the data field to display.
- Time Period sets the range of data shown. Options are: last 15 minutes, last 30 minutes, last hour, last 3 hours, last 6 hours, last 12 hours, last day, last week, last month, last 3 months, last 6 months, last year, or custom (a specific start and end date).
- Resolution sets the interval between data points. Options are: every week, every day, every 12 hours, every 6 hours, every 3 hours, every 1 hour, every 30 minutes, every 15 minutes, every 5 minutes, every 1 minute, full, or custom (a value in seconds, confirmed with the Set button).
- Calculations is available when Resolution is not set to full. For definitions and descriptions, see Calculation types.
- Curve Type is step, linear, or smooth.
- Y-Axis Range is auto or from zero.
- Heading sets the chart header. Defaults to the device name if left empty.
- Subheading sets the chart subheading. Defaults to the field name if left empty.
- Thresholds color the area below each threshold value. If two thresholds overlap, for example one at 15 and one at 10, the area below 10 uses the color of the lower threshold.