Dashboards
A dashboard is a view built for a particular audience. It carries the handful of values that audience is judged on or acts on - their KPIs - and leaves out everything else.
That is the division of labour with the rest of the platform. The device list is where you go to see every sensor, search and filter it, and drill into a single device. A dashboard is the opposite: a small, fixed selection, arranged to be read at a glance by somebody who is not hunting for a device.
So most accounts end up with several - one per audience, rather than one big one. Each dashboard is a grid of widgets that you add, configure and drag into place, and you switch between them from the dashboard name at the top left.
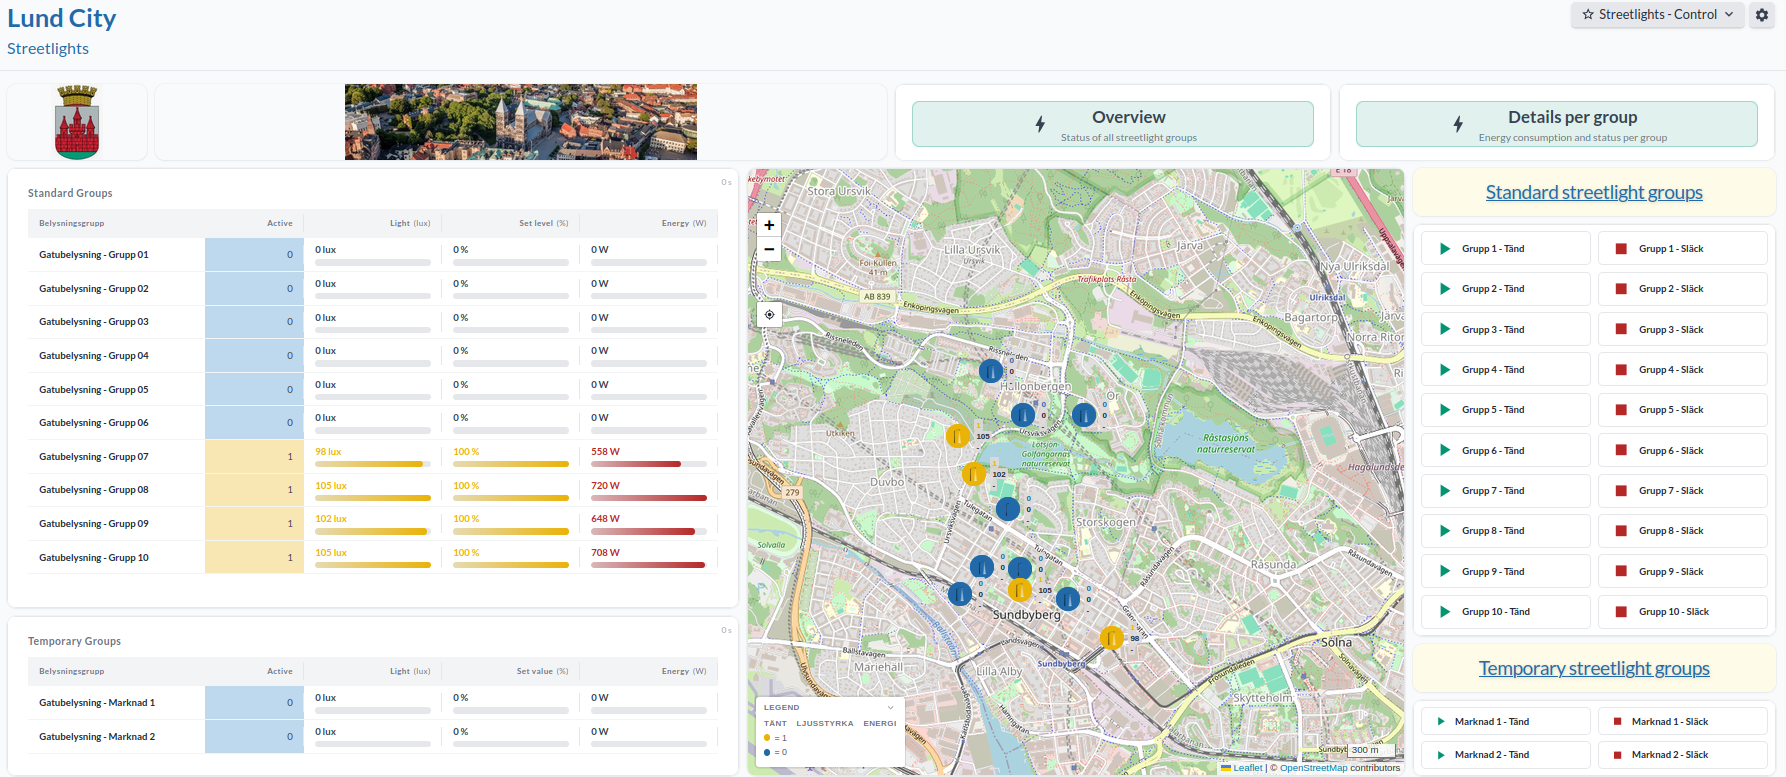
Below, a street lighting control dashboard. It gives an operator the state of every lighting group, the same groups on a map, and a command button per group to switch it on or off. The readings and the actions sit on one screen.
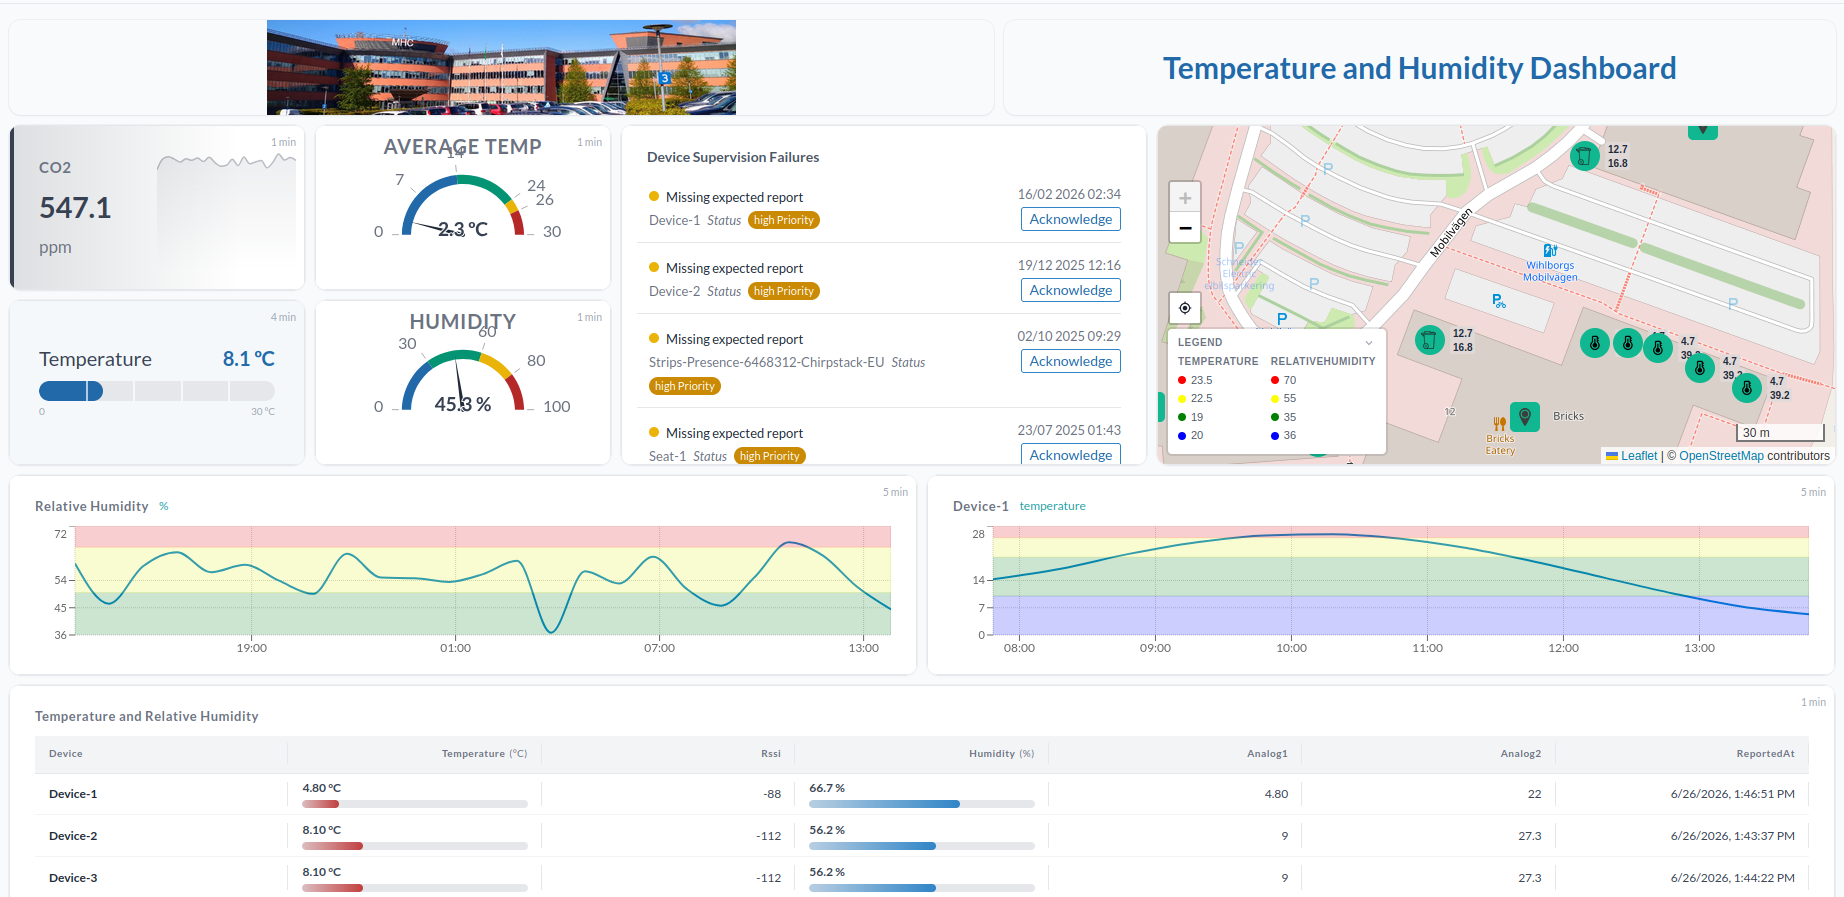
And a building monitoring dashboard for a different audience. Gauges for average temperature and humidity, a CO2 value, a floor plan with live readings, and charts banded by threshold. Beside them, the devices that have missed their expected report, each with an Acknowledge button.
A third, counting passengers on a fleet of trains. The same five devices feed three widgets here, and each answers a different question. An Equalizer shows how full each train is now. A Pie chart gives each train's share of the passengers. A stacked Multi-device chart carries the total over the afternoon, with each train's part of it.
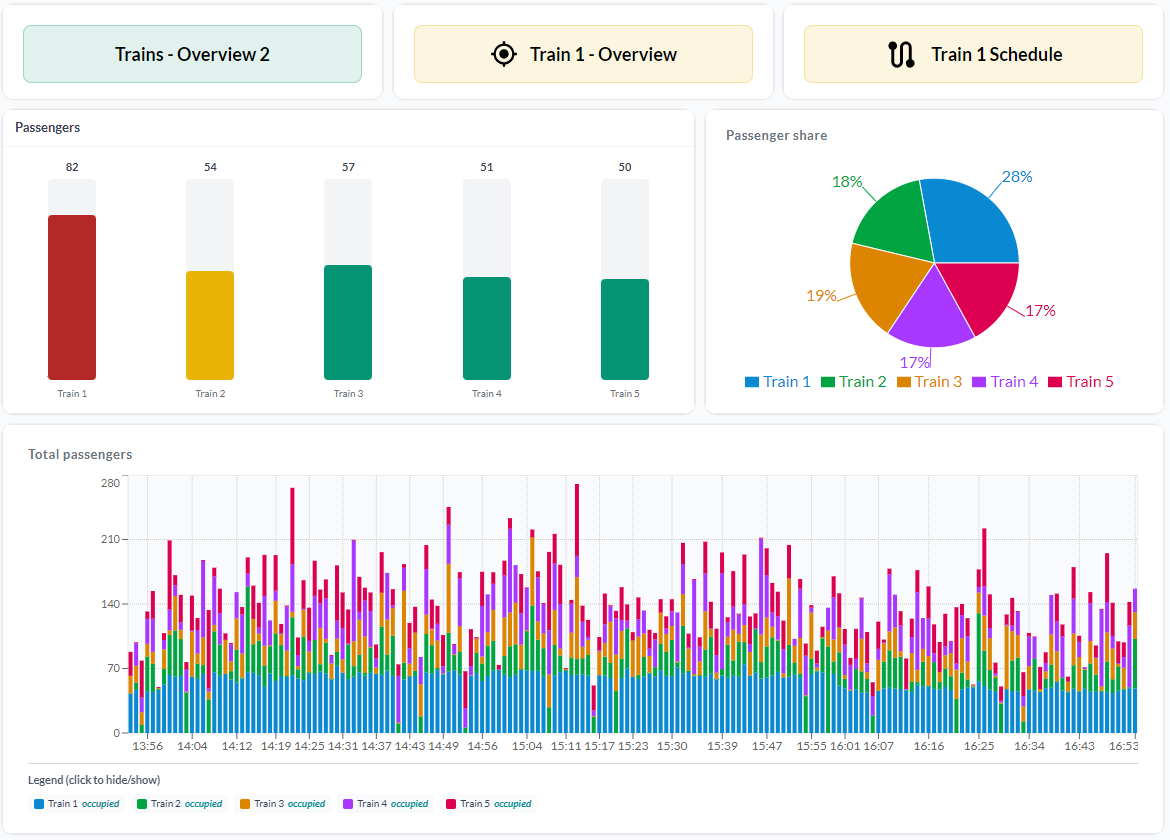
The row of buttons along its top are Navigation widgets, which jump to another dashboard. That is how a set of per-audience dashboards is tied together: an overview at the front, and a way through to the detail.
The first two carry a logo, a photo and a title, which come from the Image and Text widgets and the dashboard header. A dashboard that looks like the organisation it belongs to is easier to hand to someone outside the team.
Almost everything on this page is reached from the cog icon beside the dashboard name.
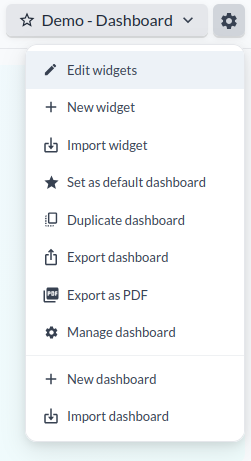
Create a dashboard
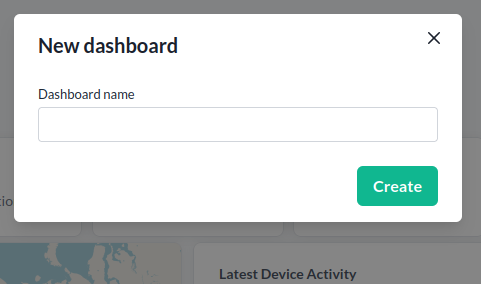
- Press the cog icon and select New dashboard.
- Enter a name.
- Press Create.
Add a widget
- Press New widget.
- Select the widget type. See The widgets for what each one does.
- Press Create.
The widget is added to the grid and configured there. Each type has its own settings, described on its own page.
The widgets
Eighteen widget types. The picker shows every one of them, each with a thumbnail and a line saying what it is for.
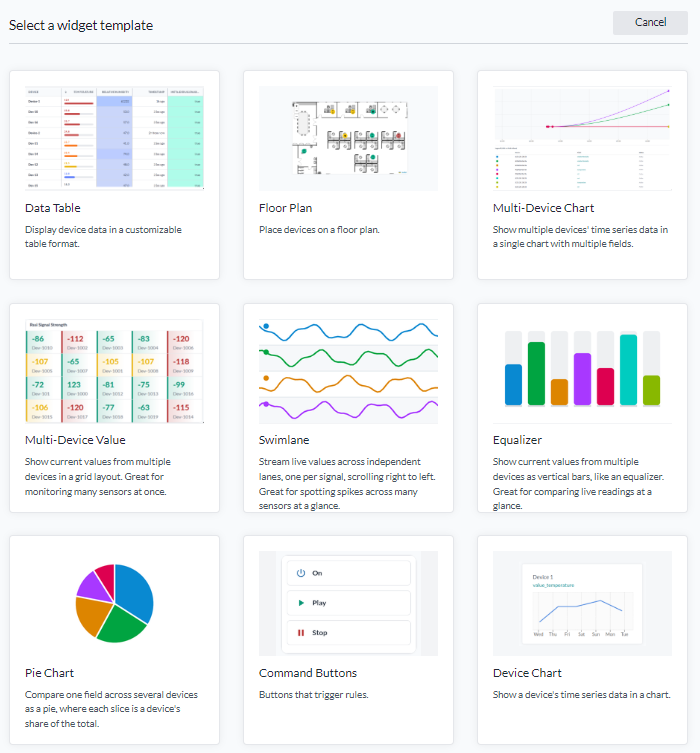
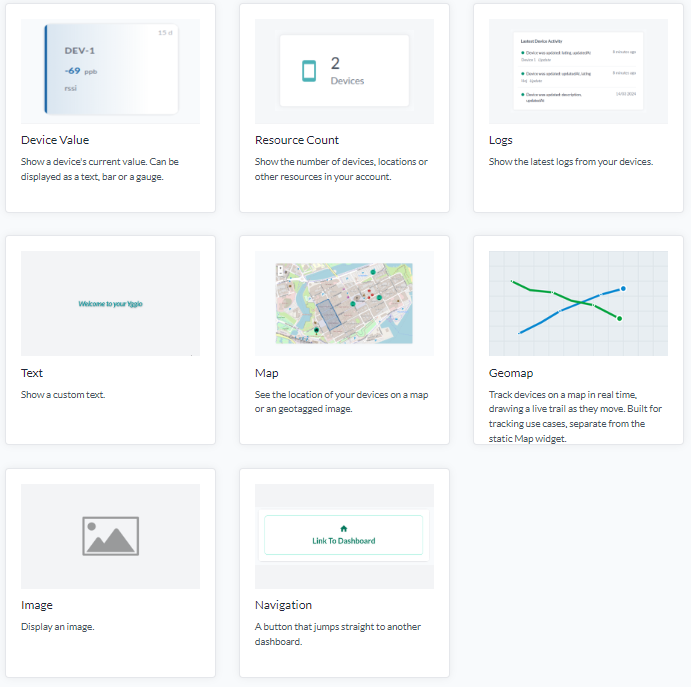
Below they are grouped by what they are for, each linking to its own page.
Several devices at once
| Widget | What it shows |
|---|---|
| Data table | Device data as a table, a column per field |
| Floor plan | Device markers placed by hand on a background image |
| Multi-device chart | Several devices and fields on one chart, over time |
| Multi-device value | Current values from several devices, in a grid |
| Swimlane | Live values streaming across one lane per signal |
| Equalizer | Current values as vertical bars on a shared scale |
| Pie chart | One field across several devices, as each one's share of the total |
One device
| Widget | What it shows |
|---|---|
| Device chart | One field from one device, over time |
| Device value | One current value, as text, circle, bar or gauge |
Maps
| Widget | What it shows |
|---|---|
| Map | Devices on a map, a saved map view, an overlay image, or geofences |
| Geomap | Where devices have been, each with its trail drawn on the map |
Everything else
| Widget | What it shows |
|---|---|
| Command buttons | Buttons that trigger a rule |
| Multi input | Inputs and switches that change device values |
| Resource count | How many devices, locations or other resources you have |
| Logs | The latest events from your devices |
| Text | Free text |
| Image | A picture |
| Navigation | A button that jumps to another dashboard |
Three pairs are easy to mix up:
- Map shows where devices are now, moving or not, with no trail; Geomap shows where a device has been.
- Floor plan places markers by hand on an image; Map with an overlay image places them at their real coordinates. See Floor plan.
- Multi-device chart plots history; Swimlane streams the present and keeps nothing.
Thresholds
Thresholds colour a value according to the range it falls in, so a number that has gone out of range is visible without being read. Most widgets that display a value support them.

Above, values below 15 °C use the base colour, 15 °C to 24 °C are green, 25 °C to 29 °C are yellow, and 30 °C or above is red.
Edit widgets
- Press Edit widgets to enter edit mode.
- Drag widgets to reposition them, or press the cog icon on a widget to edit or remove it.
- Press Update to save the changes.
- Press Exit edit widgets mode to return to the dashboard.
To change the dashboard title, press Edit header, which appears alongside Exit edit widgets mode while you are in edit mode.
Edit header
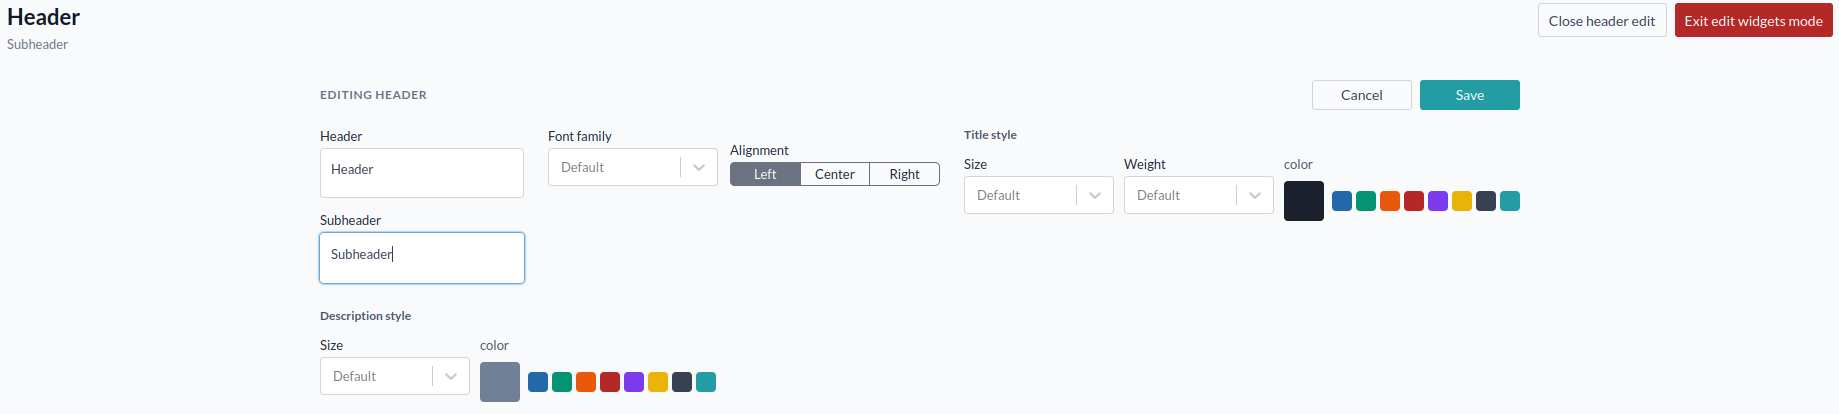
- Header sets the dashboard header text.
- Subheader sets the dashboard subheader text.
- Font family is Default, System Default, Arial, Times New Roman, Courier New, Lucida Console or Impact.
- Alignment is left, center or right.
Title style:
- Size ranges from Small (16 px) to 2X-Large (40 px).
- Weight is default, normal, medium or bold.
- Font color sets the title colour.
Description style:
- Size is Small (11 px) or X-Large (20 px).
- Font color sets the description colour.
Save before exiting.
Duplicate a widget
In edit mode, press the cog icon on a widget and select Duplicate. The copy appears on the grid and can be repositioned. Quicker than rebuilding a configured widget for a second device.
Export and import
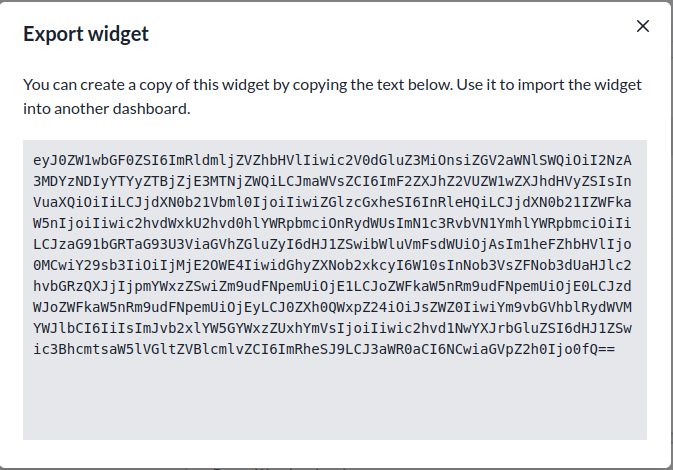
A widget or a whole dashboard can be exported as a string and imported elsewhere, including into another account. It is how a dashboard that took a while to get right reaches other people.
What survives depends on the target account:
- The same devices are available - the import is a working duplicate.
- Different devices - all settings and configuration are preserved, but devices and images have to be reselected.
Export a widget
-
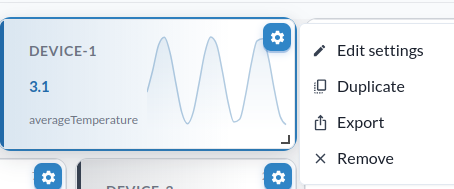
Enter edit mode.
-
Press the cog icon on the widget and select Export.
-
Copy the export string and save it.
Import a widget
-
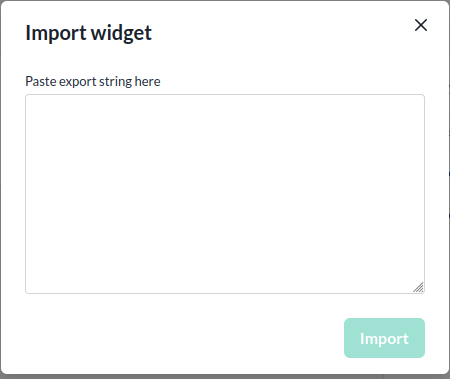
Press the cog icon and select Import widget.
-
Paste the export string.
-
Press Import.
Export a dashboard
- Press the cog icon and select Export dashboard.
- Copy the export string and save it.
Import a dashboard
- Press the cog icon and select Import dashboard.
- Paste the export string.
- Press Import.
Export as PDF
Press the cog icon and select Export as PDF to save the dashboard as it currently looks.
Duplicate a dashboard
Press the cog icon and select Duplicate dashboard.
Set a default dashboard
Press the cog icon and select Set as default dashboard. The star beside the dashboard name turns yellow, and that dashboard is what you see on login.
Manage a dashboard
- Press the cog icon and select Manage dashboard.
- Rename the dashboard, set access rights (admin, write, read or peek), or delete it. See Access rights for what each level allows.
- Press Done.
Sharing a dashboard shares the dashboard, not the devices on it. Someone without access to a device sees an empty widget where its values would be.