Lesson 3.2 Power BI
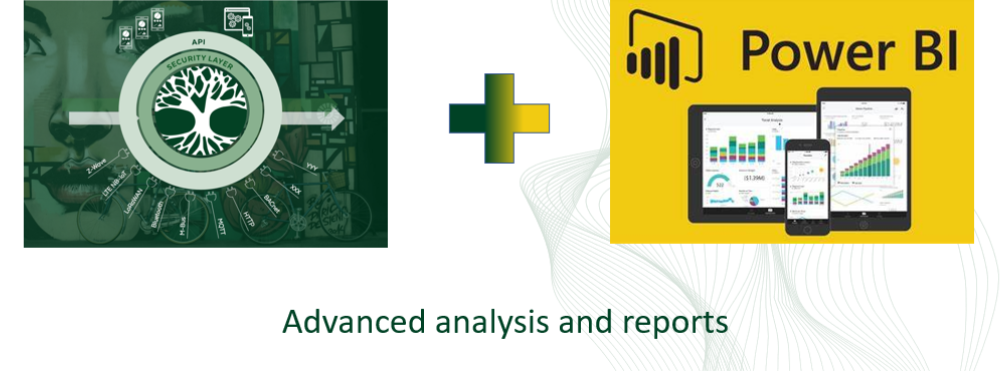
The IoT platform's Power BI Custom Connector brings your device data straight into Power BI Desktop for advanced analysis and reporting - asset overviews, energy KPIs, billing reports, and more. In this lesson you'll install the connector, pull in some data, and build a first chart.
The full reference is the Power BI user guide; this lesson is the hands-on walkthrough.
Before you start
- Power BI Desktop on Windows (Power BI isn't supported on Mac/Linux), and local admin on the machine.
- An IoT platform account with some devices reporting data.
- The IoT platform's Power BI connector download (see the user guide's Downloads).
Exercise 1 - Install the connector
- Extract the connector zip - it contains
YggioConnector.pqxandYggio_regkey.reg. - Put
YggioConnector.pqxinDocuments\Power BI Desktop\Custom Connectors(create the folder if needed). - Double-click
Yggio_regkey.regand accept - this trusts the connector. - Restart Power BI Desktop, then check Get Data → More… and search Yggio to confirm it's there.
Exercise 2 - Connect and pull data
- Get Data → Yggio → Connect.
- Enter your IoT platform server URL and sign in (username + password, or an API key token).
- Choose the
Chartquery. Pick a few devices and up to 4 measurements (e.g.temperature), and click Apply to preview. - Set Time period (e.g. last 7 days), Resolution (e.g. every hour) and Value function (e.g. mean), then tick the query and click Load.
Exercise 3 - Build a chart
- In the report view, change the time column's type from
datetimetotime- this is the most common thing people miss (Power BI groups the data otherwise). - Add a Line chart; drag the time column to the axis and your measurement to values.
- Try a Bar/Column chart grouped by day for a per-day view.
Exercise 4 - A useful report (stretch)
- Billing / IMD report: in the
Chartquery use Time period = last 3 months, Resolution = every day, Extra date columns = true, Value function = difference, then sum the daily deltas per month. - Energy-efficiency KPI: use the
ChartEnergyquery with your energy, outdoor-temperature, indoor-temperature series and the building area. This is the same formula as theanalytics-building-energy-efficiencytranslator - use that translator instead if you want the KPI computed inside the platform rather than only in Power BI.
What you learned
- How to install and trust the IoT platform's Power BI connector.
- How to connect, choose a query, and pull device/time-series data.
- The
datetime → timegotcha, and how to build charts and a billing/KPI report.
Where next
- Power BI user guide - the full function reference
(
Chart,ChartEnergy,IotNodes,Overview, …), resolution/value-function detail, scheduled refresh via a gateway, and troubleshooting. - Next lesson: Node-RED.