Lesson 3.0 Advanced usage
This module goes beyond the day-to-day platform features covered in Lessons 1 and 2 and into the IoT platform's advanced analytics and integration capabilities: decoding your own hardware, connecting external tools, and building rich reports and dashboards.
Each lesson is hands-on and links to a fuller developer/user guide for depth.
Lessons in this module
-
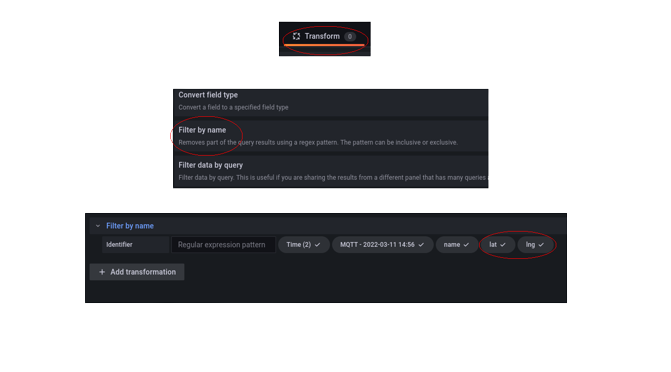
3.1 Grafana - build live dashboards, maps, fleet tables and alerts from your device data.
Grafana is a popular open-source tool for dashboards, maps and alerts. The IoT platform provides two dedicated Grafana data sources, giving you both live and historical device data to work with, so you can build fleet overviews and get notified when something goes wrong.
-
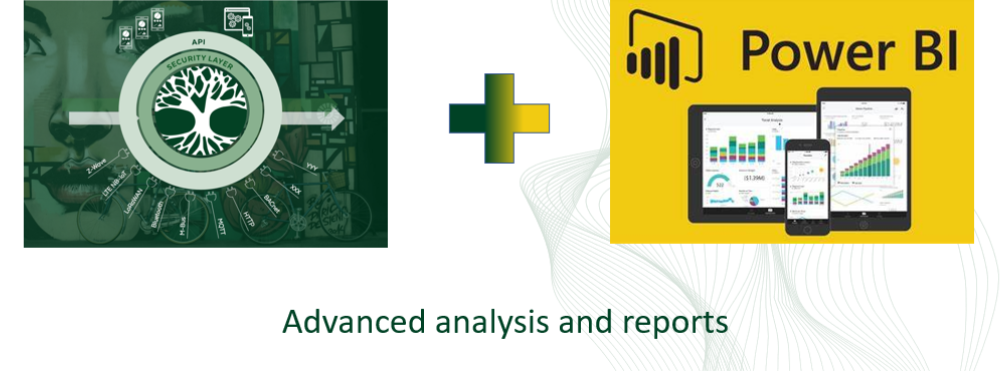
3.2 Power BI - pull data from the IoT platform into Power BI for advanced analysis, energy KPIs and billing reports.
The IoT platform's Power BI Custom Connector brings your device data straight into Power BI Desktop for advanced analysis and reporting: asset overviews, energy KPIs, billing reports and more. Power BI Desktop only runs on Windows.
-
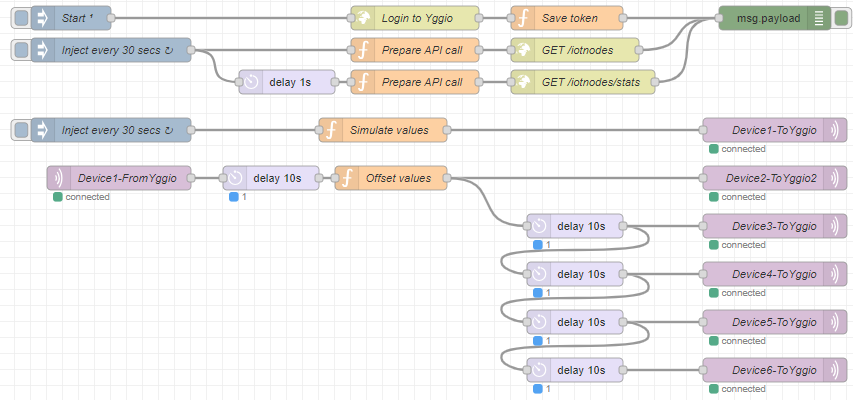
3.3 Node-RED - simulate devices, integrate third-party systems, and use Node-RED as an SDK for developing translators.
Node-RED is a low-code, flow-based tool for wiring together hardware, APIs and services. With the IoT platform it's used to simulate devices, integrate third-party systems, and as an SDK for building and testing translators.
-
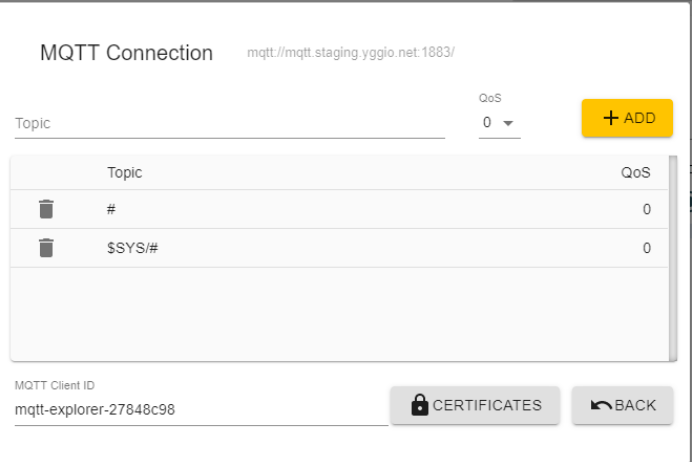
3.4 MQTT Explorer - publish to and subscribe to the IoT platform's MQTT broker to test data flowing in and out.
MQTT Explorer is a free desktop tool for publishing and subscribing to MQTT topics, the quickest way to test the IoT platform's MQTT broker in both directions: sending data in to create or update a device, and watching data the platform publishes out. Several earlier lessons already rely on it; this lesson gathers the key usage in one place.
-
3.5 Postman - call the IoT platform's REST API from a GUI: authenticate, read devices, push data, import CSV time series.
Postman is a graphical HTTP client for exploring and calling the IoT platform's REST API: logging in, reading devices, pushing data and running saved request collections.
-
3.6 Curl - the same REST API calls from the command line, ready to script.
curlmakes the same REST API calls as Postman, but straight from the command line, ideal for quick tests and for scripting or automation. This lesson mirrors the Postman lesson usingcurl. -
3.7 Translator development - build, test and upload your own payload decoders that emit the IoT platform's canonical data model. This is the most advanced lesson: real software development, so it comes last.
A translator decodes a device's raw payload into the IoT platform's flat, canonical data model, turning a manufacturer-specific field or a hex blob into consistently named, unit-tagged values such as
temperaturein °C. Earlier lessons only used translators; this one builds, tests and uploads your own.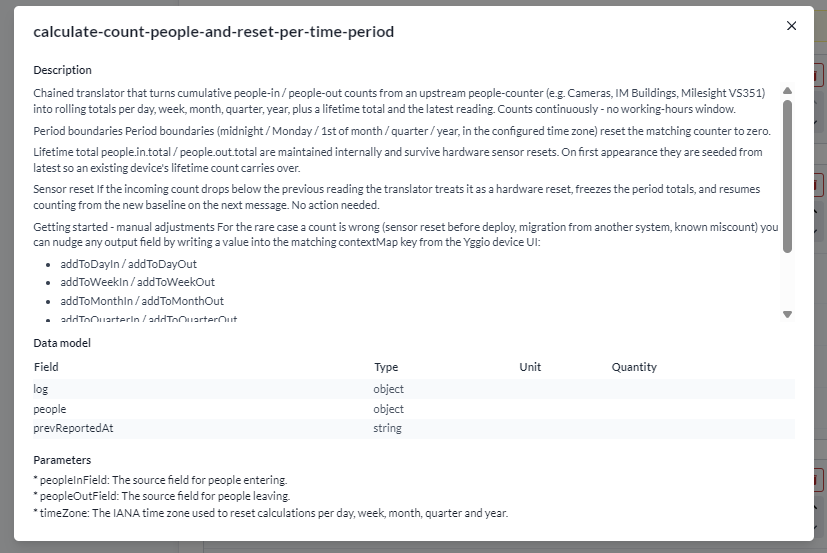
What ties them together
They all build on the same foundation you learned earlier: every device's data is normalized to one canonical data model (consistent field names, units and quantities). That consistency is what lets a translator, a Grafana panel, a Power BI report or a Node-RED flow work across any device - the theme running through this whole module.
Suggested order
Do them in order if you're new to these topics - they run from operating the platform to building your own translators (the most advanced topic) last. If you only need one, each lesson stands on its own - start with the tool you need:
- Want to visualize data → Grafana or Power BI.
- Want to simulate or integrate → Node-RED.
- Want to talk to the API or MQTT broker directly → MQTT Explorer, Postman or Curl.
- Want to decode a new device → Translator development.