Grafana Setup
The platform has API-support for two Grafana Data Sources:
- The JSON data source. This enables API-users to host their own Grafana and view time-series data from the platform.
- The Infinity Data Source. This enables Grafana to use all of the IoT platform's REST API and visualize data and also use the Grafana Alert Manager for rules.
Below you find instructions and help on how to set it up. For building panels once it's connected, see the Grafana user guide.
Setup at a glance
Connecting Grafana to the IoT platform is five steps, in order:
- Create an account on the IoT platform - provides the credentials.
- Create a client app in the IoT platform - save the secret.
- Install Grafana and configure OAuth against the IoT platform (the
custom.inibelow). - Add a data source - JSON for quick time-series & maps, Infinity for the full REST API + alerting.
- Start graphing - build your first panel.
You need: an account on the IoT platform, and admin rights on the Grafana instance (to edit its config and install plugins). Grafana 9.0.x or higher.
Version compatibility
| Component | Verified version |
|---|---|
| Grafana | 9.0.x or higher |
simpod-json-datasource (JSON) | 0.6.x |
yesoreyeram-infinity-datasource (Infinity) | 3.6 |
API-user
First, you need to make sure that you have created an account on the IoT platform. This account will be used to create the credentials used by the Grafana-app.
Client App
In order to use the API you need to create a client app. It's recommended to use the interactive API-documentation for this. The endpoint to use is POST /api/client-apps. Make sure to save the secret.
Installing Grafana
Currently we have support for versions 9.0.x or higher.
Follow the Grafana installation instructions. Grafana then needs some custom configuration to connect to the IoT platform; the example below is the minimum needed to get it running (see the Grafana configuration docs for how custom configuration works).
The example is written for this server (staging.yggio.net). If you are integrating with a different instance of the IoT platform, use that platform's documentation for the correct URLs.
Change the following to match your setup:
domain- the public IP or domain name where you host Grafanaroot_url- the same, with thehttp/httpsschemesignout_redirect_url- update theredirect_uriquery parameter to your Grafana login URLclient_id- the client_id from when creating the client appclient_secret- the secret from when creating the client app
#### custom.ini ####

[server]
domain = grafana-test.your-domain.com
root_url = https://grafana-test.your-domain.com

[auth]
signout_redirect_url = https://staging.yggio.net/auth/realms/yggio/protocol/openid-connect/logout?redirect_uri=https%3A%2F%2Fgrafana-test.your-domain.com%2Flogin
token_rotation_interval_minutes = 60

[auth.generic_oauth]
enabled = true
allow_sign_up = true
name = Yggio
client_id = grafana-test-client
client_secret = abcabcabcabc-test-test-test-cbacbacbacba
auth_url = https://staging.yggio.net/auth/realms/yggio/protocol/openid-connect/auth
token_url = https://staging.yggio.net/auth/realms/yggio/protocol/openid-connect/token
api_url = https://staging.yggio.net/auth/realms/yggio/protocol/openid-connect/userinfo
scopes = openid, email, profile, offline_access
The offline_access scope ensures that once you have logged in to Grafana, a refresh token is used to automatically renew your session, so you don’t need to log in again. This makes Grafana feel like an embedded platform application.
How the authentication works
Grafana signs users in against the IoT platform's identity provider (Keycloak) via OpenID
Connect ([auth.generic_oauth]). Each data source then has Forward OAuth
Identity enabled, so Grafana forwards the logged-in user's token on every
request to the IoT platform's API. As a result each Grafana user sees exactly the
devices and data their own account on the IoT platform has access to - there is no shared
service account, and access is governed by the IoT platform's permissions. The
offline_access scope keeps the session alive by refreshing the token.
Data Sources
Note that it's required to have admin-privileges to add and configure plugins in Grafana.
Here you can find some information on how to install plugins on Grafana.
Installation of JSON Data Source
Currently we have support for simpod-json-datasource plugin versions 0.6.x.
Here is instruction on how to install JSON data source plugin specifically.
Configuration
Leave everything at its default except the two settings below.
- URL:
<yggio rest-api URl>/api/grafana/iotnodes(e.g.https://staging.yggio.net/api/grafana/iotnodes) - Forward OAuth Identity:
true
Installation Infinity data source
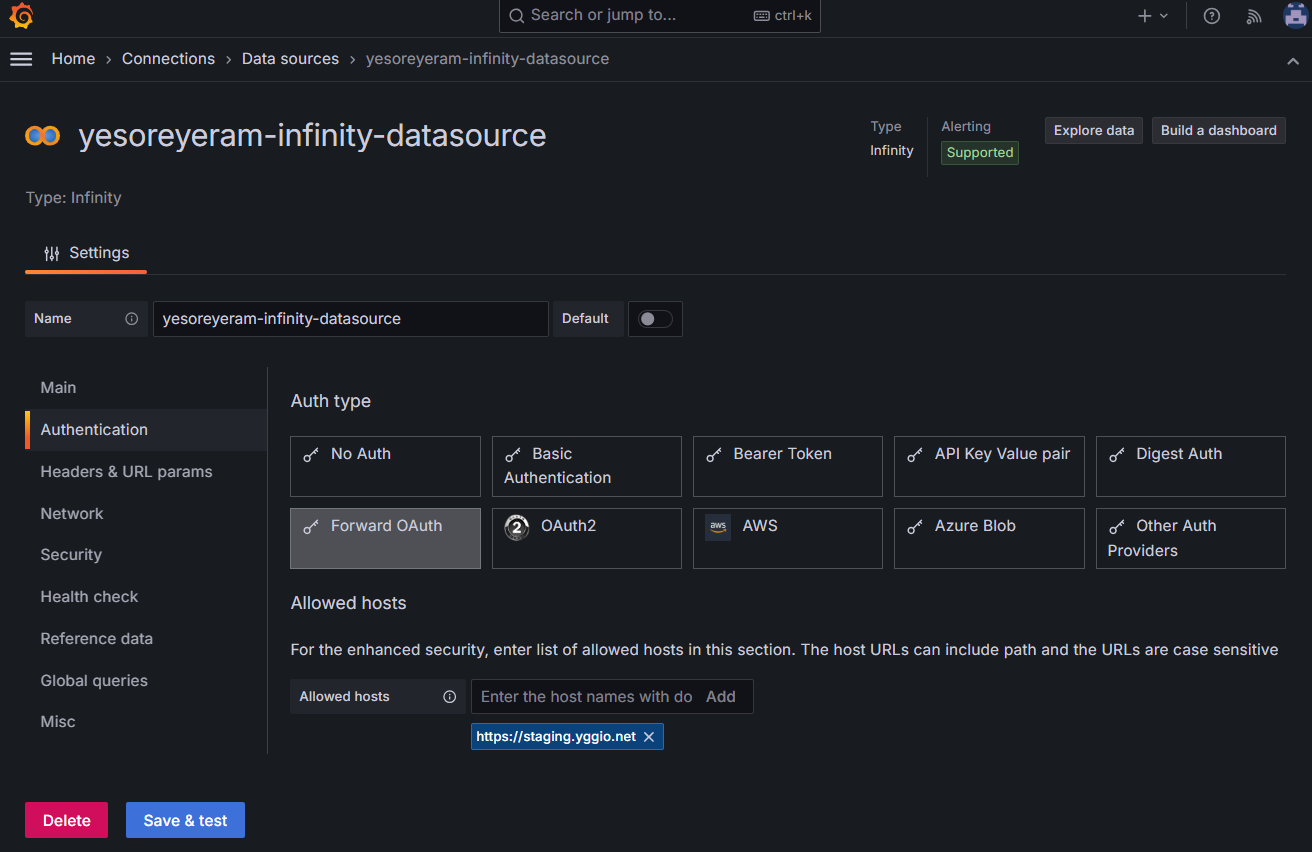
Currently we have support for yesoreyeram-infinity-datasource. The support is verified with version 3.6
Configuration
Leave everything at its default except the two settings below.
- Forward OAuth Identity:
true - Allowed Host:
<Platform URL>(e.g.https://staging.yggio.net)
This is how you should configure and use the Infinity Data Source
Which data source should I use?
| JSON data source | Infinity data source | |
|---|---|---|
| Purpose | Time-series values for graphs/maps | Any endpoint of the IoT platform's REST API (tables, charts, maps) |
| Endpoint | /api/grafana/iotnodes (fixed) | any GET URL you paste from Swagger |
| Best for | Quick device value & GPS graphs | Full flexibility + Grafana alerting |
How the IoT platform's data appears in Grafana
- A metric in the JSON data source is an
iotnode(device). Selecting the wildcard*returns all your active devices. - Each device's fields use the IoT platform's canonical field names (e.g.
temperature,relativeHumidity,lnglat,rssi,snr) - the same names across every vendor, so one dashboard works across mixed hardware. See the data-model field table in the Translator API reference. - Location: a device with
lnglatexposeslat/lngfor Geomap panels (filter them out of time-series graphs with a Filter by name transform). - Time series via the Infinity data source come from
GET /api/iotnodes/<id>/stats?measurement=<field>&start=<unix ms>&distance=<seconds>.
Alerting
The Infinity data source works with Grafana's alert manager, so you can define alert rules directly on the IoT platform's REST API data (thresholds, absence of data, etc.) and route notifications through Grafana's contact points. The JSON data source is intended for visualization rather than alerting.
Troubleshooting
- Login loops / redirect errors - the
redirect_uriinsignout_redirect_urland Grafana'sroot_url/domainmust match the actual public URL of your Grafana, and the client app's allowed redirect must include it. - Panels show no data but login works - check Forward OAuth Identity is
trueon the data source; without it Grafana calls the API unauthenticated. - Infinity: request blocked - add your IoT platform domain to the data source's Allowed Hosts.
- A device or field is missing - Grafana only sees what your account on the IoT platform
can access, and a device only exposes fields its translator emits; confirm
both in
https://staging.yggio.net/swagger.
Start Graphing!
Once above steps are done it should be possible to create a dashboard and a panel with data from the platform! Go to user guide for Grafana