Power BI
IoT-plattformens Power BI Custom Connector gör det möjligt för en användare att på ett snabbt och enkelt sätt hämta data direkt från ett konto på IoT-plattformen till Power BI Desktop för avancerad analys. Att skapa rapporter som de nedan tar bara några minuter efter lite träning.
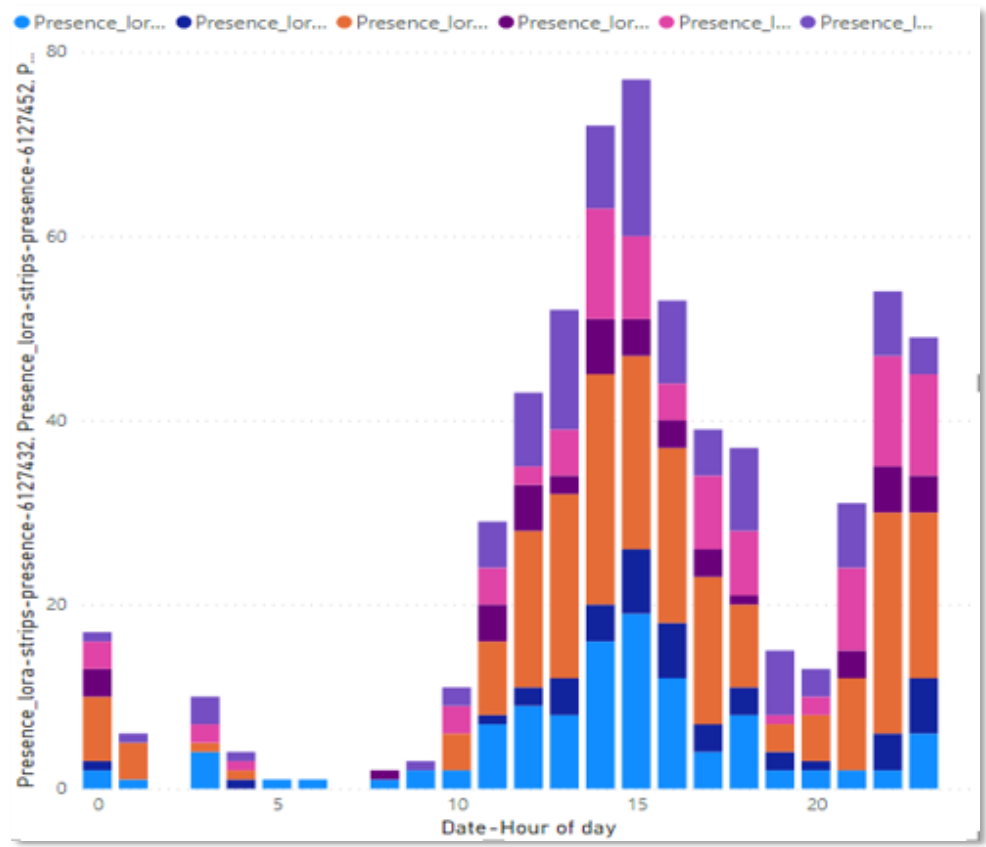
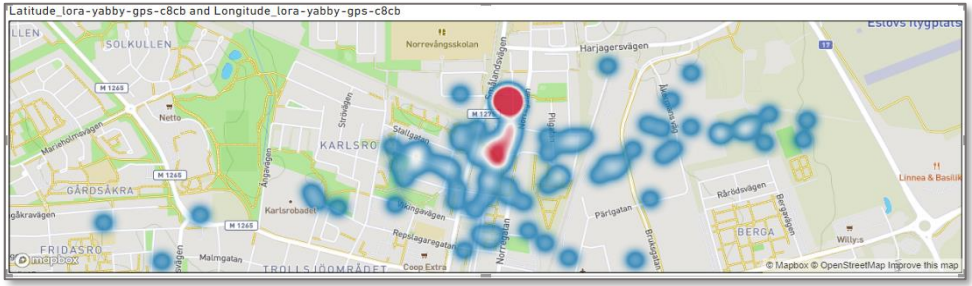
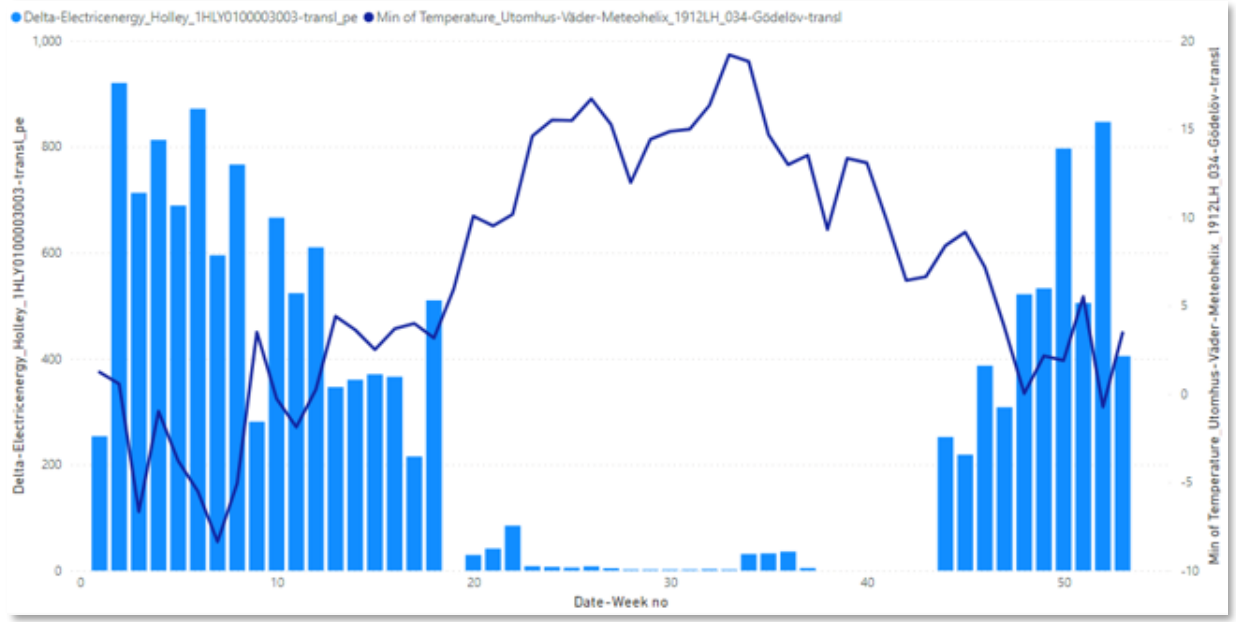
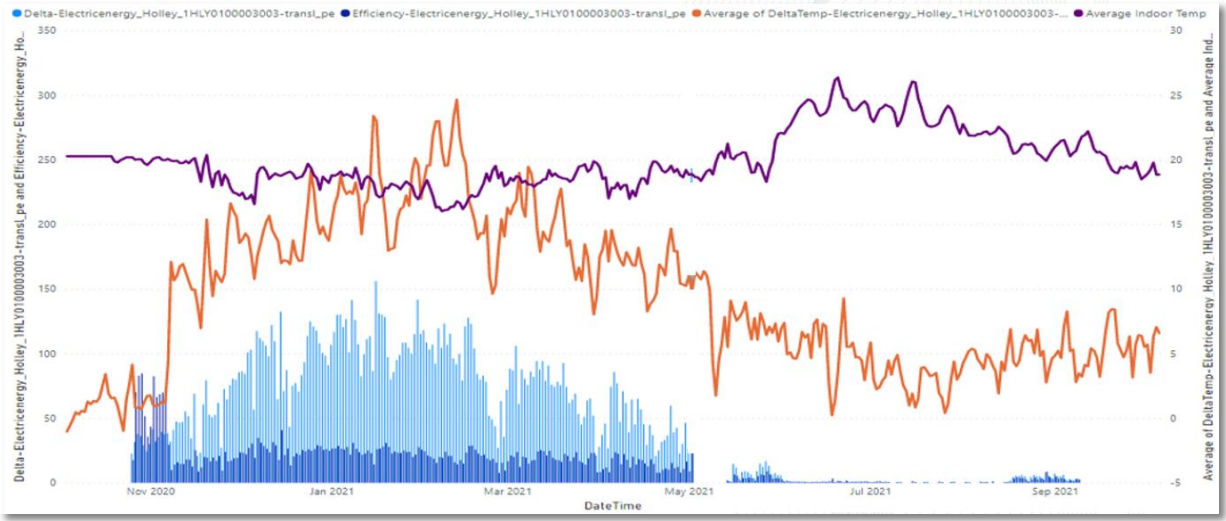
Efter att ha exporterat rapporterna till Power BI-molnet och installerat en Power BI Enterprise-gateway med åtkomst till IoT-plattformens connector, kan de också uppdateras och delas automatiskt. Att använda Power BI-molnet är dock inte ett krav - Power BI Desktop fungerar bra på egen hand.
1. Kom igång
1.1 Installation
För att installera måste du använda en Windows-dator (Power BI stöds inte på Mac eller Linux) och vara lokal administratör (eller ha en IT-policy som tillåter att nödvändiga komponenter installeras av användare).
-
Ladda ner och installera Power BI Desktop från Microsoft: https://docs.microsoft.com/en-us/power-bi/fundamentals/desktop-get-the-desktop
-
Ladda ner IoT-plattformens Power BI Custom Connector-zipfilen från plattformens Docs / Power BI (eller där IT instruerar) och packa upp de två filerna:
YggioConnector.pqxochYggio_regkey.reg.-
Placera
YggioConnector.pqxi denna mapp (skapa den om den inte finns - använd exakt denna stavning):[Documents] > Power BI Desktop > Custom Connectors(på engelsk Windows:C:\Users\<du>\Documents\Power BI Desktop\Custom Connectors) -
Dubbelklicka på
Yggio_regkey.regoch acceptera att den ändrar datorn. Detta installerar Sensatives certifikat-thumbprint i registret och låter Power BI använda connectorn utan att ändra Power BI:s säkerhetsinställningar.Om thumbprinten inte är installerad kommer Power BI att klaga på att den inte kan validera IoT-plattformens connector. För att använda den ändå, sänk säkerhetsinställningen via File → Options and Settings → Global → Security → Data Extensions → (Not recommended) Allow any extension to load without validation or warning.
-
-
Starta om Power BI Desktop. För att bekräfta att installationen fungerade, öppna Get Data → More… och sök på Yggio - connectorn bör dyka upp.
1.2 Begränsningar
Det här dokumentet täcker funktionaliteten hos IoT-plattformens Power BI Custom Connector. Det beskriver inte (bortsett från ett par tips) allmän Power BI-användning, som dokumenteras på https://docs.microsoft.com/en-us/power-bi/.
Snabbstart: ditt första diagram
När connectorn är installerad är detta den kortaste vägen till ett fungerande diagram:
- Get Data → More… → Yggio → Connect.
- Ange URL:en för din IoT-plattformsserver och logga in (användarnamn + lösenord, eller en API- nyckeltoken).
- Välj
Chart-frågan, välj upp till 8 enheter och upp till 4 mätningar (t.ex.temperature), och klicka på Apply för att förhandsgranska. - Ställ in de tre parametrarna som avgör vad du får: Tidsperiod (t.ex. senaste 7 dagarna), Resolution (t.ex. varje timme), och Value function (t.ex. mean).
- Markera frågan och klicka på Load.
- I rapportvyn, ändra tidskolumnens typ från
datetimetilltime(se tipset nedan) - det här är det vanligaste misstaget. - Lägg till ett Line chart, dra tidskolumnen till axeln och din mätning till values. Klart.
Allt nedan förklarar varje steg och de mer avancerade alternativen i detalj.
2. Översikt över funktionalitet
2.1 Grunder - tre sätt att ansluta
Connectorn erbjuder tre sätt att ansluta till IoT-plattformen och hämta data, var och en med en annan balans mellan användarvänlighet och hur mycket data du kan hämta:
- Navigator - Get Data → sök "Yggio" → anslut till en server. Det mest guidade, enklaste sättet att börja. Tidsseriediagram är begränsade till 8 noder × 4 tidsseriefält, valda från en fördefinierad lista eller angivna manuellt. Fungerar bra för de flesta användningsfall.
- Formula bar (guidad) - Get Data → Blank query → skriv
=Yggiooch välj en funktion från listan. Öppnar en guide i 2–3 steg som tar bort en del av Navigators begränsningar. För diagram kommer de 3 första tidsseriefälten från de valda noderna och det 4:e från den fördefinierade listan. - Fri fråga i formula bar - Get Data → Blank query → skriv
=Yggiooch skriv hela frågan själv. Med listor kan du gå bortom 8 noder × 4 fält - alla begränsningar tas bort. Du behöver känna till frågesyntaxen, nodnamn, alternativ och fältnamn (allt dokumenterat direkt i Power BI). Använd detta för att (a) hämta tidsserier från fler än 8 noder, eller (b) använda PowerQuery M-språket för komplexa datamängder.
Ett bra sätt att lära sig fri-fråge-syntaxen är att först bygga en fråga med Navigator eller den guidade formula bar, och sedan ändra den resulterande frågan.

För mycket avancerade användare kan IoT-plattformens frågor användas från Power BI:s avancerade redigerare (PowerQuery) för att bygga komplexa frågor som aggregerar data från olika källor.
2.2 Funktioner (connector-funktioner)
Välj en funktion efter mål:
| Jag vill… | Använd |
|---|---|
| Rita mätningar över tid | Yggio.Chart |
| Bygga ett energieffektivitets-KPI för en byggnad | Yggio.ChartEnergy |
| Se vilka mätningar en enhet har | Yggio.ChartFields |
| Jämföra aktuella värden för flera enheter | Yggio.IotNode (kolumner) eller Yggio.IotNodes (rader) |
| Lista enheter och när de senast rapporterade | Yggio.Overview |
| Se vilka översättare (dekodrar) som finns | Device Models |
Fullständig lista:
| Funktion | Returnerar |
|---|---|
Yggio.Chart | En kub av generell tidsseriedata (X noder × Y fält × Z tid). Valfria extra statistikkolumner och värdefunktioner (mean, max, min, first, last, count, sum, difference) för snabb skapelse av avancerade diagram och rapporter (t.ex. faktureringsrapporter). |
Yggio.ChartEnergy | Tidsseriedata för en byggnads energieffektivitets-KPI, baserat på energiförbrukning, utomhustemperatur, medelinomhustemperatur och byggnadsarea. |
Yggio.ChartFields | De tillgängliga tidsseriefälten för de valda noderna. |
Device Models | De tillgängliga enhetsdekodrarna - "översättare" i IoT-plattformens terminologi (de normaliserar oftast även dataformatet till FIWARE-standarden, inte bara avkodar). |
Yggio.IotNode | Aktuell data för flera IoT-noder formaterad i kolumner, för att göra dem lätta att jämföra. |
Yggio.IotNodes | Aktuell data för flera IoT-noder formaterad i rader, för att öka synligheten av tillgänglig data. |
Yggio.Main | Öppnar Navigator-huvudmenyn i tabellformat. Används normalt inte från formula bar. |
Yggio.Overview | En översikt över enheterna på ett konto och när de senast rapporterade. |
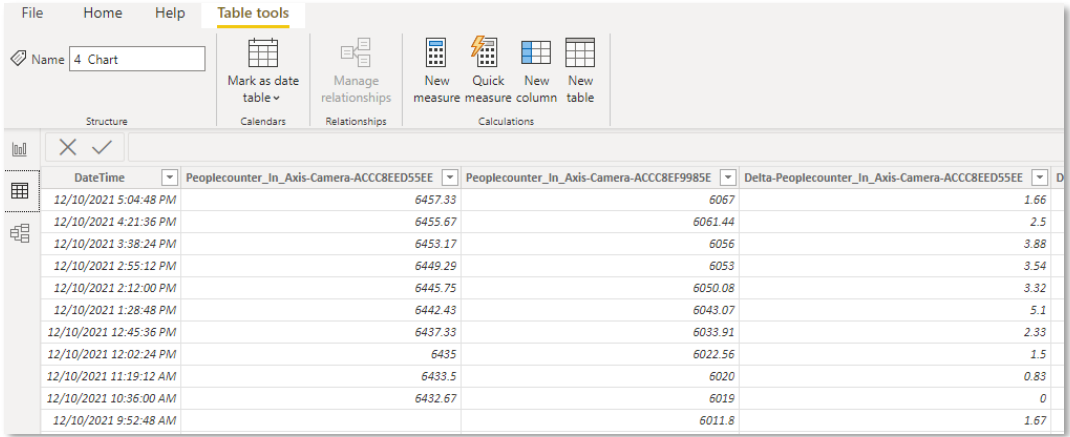
Fältnamn följer IoT-plattformens kanoniska datamodell (översättare normaliserar tillverkardata till en FIWARE-anpassad modell), så samma fält betyder samma sak för alla enheter - se fälttabellen i utvecklarreferensen Translator API.
2.3 Ansluta till IoT-plattformen
Efter att ha valt "Get Data" (eller startat en fråga för IoT-plattformen från formula bar), välj connectorn Yggio, ange sedan URL:en för den önskade IoT-plattforms- servern.
Ange därefter autentiseringsuppgifter för att logga in - antingen ditt användarnamn och lösenord, eller en API-nyckeltoken. Dessa lagras i Power BI:s autentiseringsuppgiftslista och återanvänds nästa gång du ansluter till samma server. IoT-plattformens API-nycklar upphör att gälla efter en tid, så uppdatera dem regelbundet. För att logga in på ett annat konto, rensa serverns sparade autentiseringsuppgifter via File → Options & Settings → Data source settings.
Använd en API-nyckeltoken på delade eller rapporterande maskiner så att inget personligt lösenord sparas (kom ihåg att den upphör att gälla); användarnamn/lösenord är bekvämt på din egen dator.
För att göra det enkelt att byta mellan servrar och konton använder connectorn en lista med
fördefinierade servers kortnamn plus en användardefinierad tagg. Till exempel, BY
motsvarar https://beta.yggio.net, och BY+demo sparar autentiseringsuppgifter under
datakällsökvägen BY+demo - så BY+test kan användas som en annan sökväg för att logga
in på ett annat konto på samma server. Några referenskortnamn:
PY= https://public.yggio.netEU= https://yggio.euBY= https://beta.yggio.netY3B= https://yggio3-beta.sensative.netYG= https://ygg.io
Kortnamnet plus taggar gör att en dataanalytiker/rapportspecialist som hanterar flera konton på en server snabbt kan växla mellan dem. Om du får ett fel när Power BI försöker hämta data kunde den angivna server-URL:en inte hittas - ange en giltig server-URL eller ett kortnamn.

2.4 Användarvänlighet
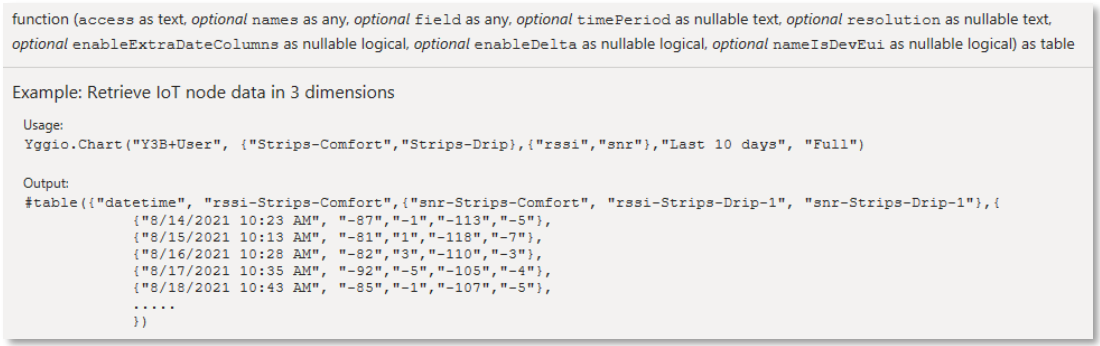
Connectorn är tolerant i sin syntax: den försöker tolka vad du vill. Exakta
namn krävs inte - t.ex. hämtar Temp det första tidsseriefältet som
(i gemener) börjar med temp; en tidsperiod 2 m hämtar de senaste två
månaderna. Inuti Power BI dokumenteras hela syntaxen och alternativen i detalj, så
även att skriva frågor för IoT-plattformen i den avancerade redigeraren är relativt enkelt.
2.5 Flerspråksstöd
Connectorn är flerspråkig och följer språket för Power BI-installationen. Den stödjer för närvarande engelska och svenska.
3. Använd connectorn för att hämta data
3.1 Navigator-gränssnittet och parametrar
I Power BI, klicka på Get Data och sök på Yggio.
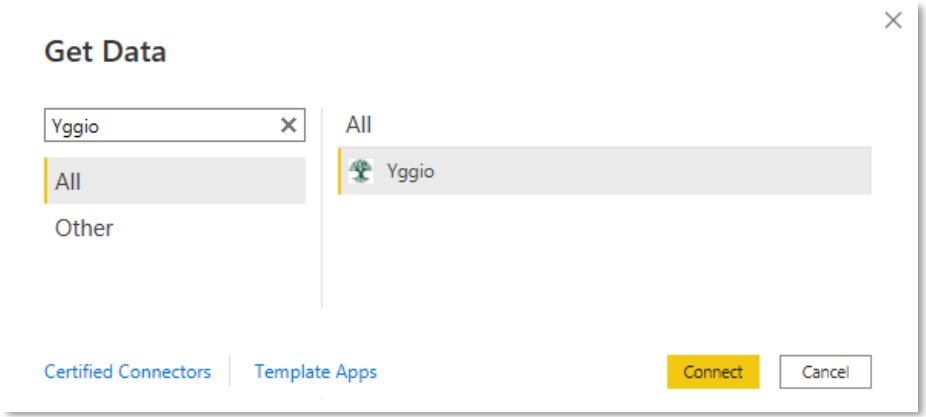
Efter Connect, ange dina autentiseringsuppgifter i connectorns Navigator-gränssnitt, välj den önskade frågan och följ alternativen.
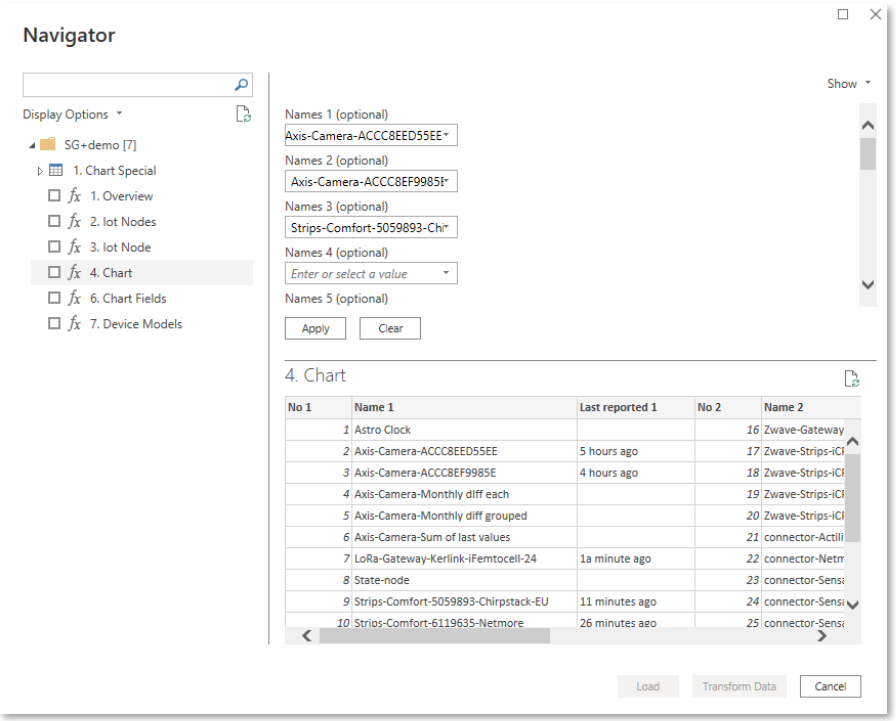
Som standard fylls förhandsgranskningsfönstret (nere till höger) med tillgängliga IoT-noder och tidsseriefält efter att ha klickat på Apply - mycket användbart för att bekräfta att du får rätt data innan den läses in i Power BI.
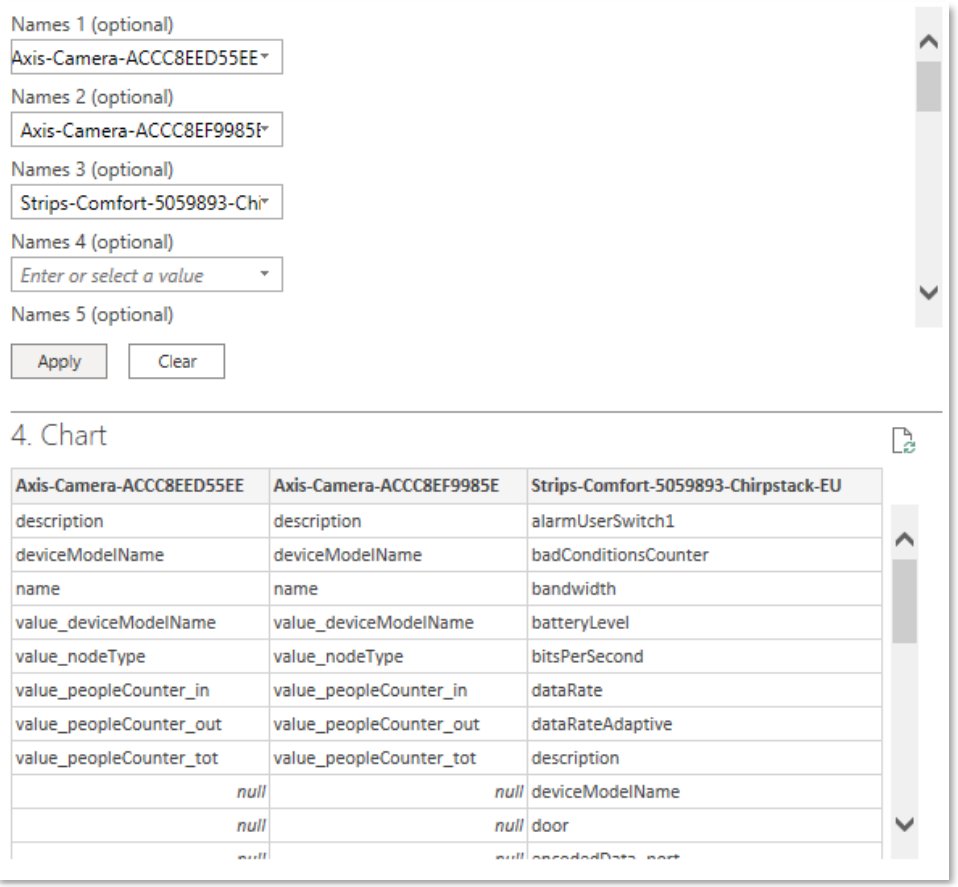
Chart-frågan har viktiga valfria parametrar:
- Time period - tidsintervallet för data att hämta.
- Resolution - dataupplösningen. IoT-plattformen returnerar högst 1000 datapunkter
per tidsseriefält.
- Every hour/day/week/month/quarter - en datapunkt per bucket.
- Full resolution - varje datapunkt (1000-punktsgränsen begränsar långa intervall på högfrekventa enheter).
- High resolution - när ett minimiavstånd mellan punkter överskrids, försöker den hämta maximalt 1000 punkter för perioden.
- Low resolution - som high, men med ett längre minimiavstånd mellan punkter.
- Enable calculation of utilization via extra date columns - lägger till kolumner som grupperar data efter timme på dygnet, veckodag, veckonummer, etc., vilket kraftigt förenklar grupperade rapporter.
- Value function - beräkningen som tillämpas per upplösnings-bucket: mean, min, max, first, last, count, sum, difference. Till exempel ger Resolution = every day med Value function = max det dagliga maxvärdet; difference på en kumulativ mätare ger förbrukningen per dag.
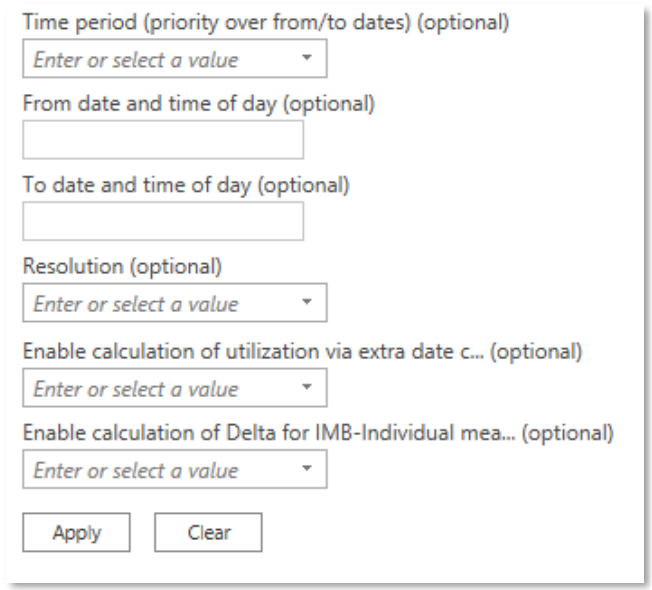
Tips för faktura-/IMD-rapport (Individuell mätning och debitering): Time period last 3 months, Resolution every day, Extra date columns true, Value function difference - summera sedan deltavärdena per månad med Power BI:s standardtransform- och rapportfunktioner.
Energieffektivitetsdiagram (ChartEnergy)
Den mest avancerade funktionen, Yggio.ChartEnergy, beräknar ett energieffektivitets-
KPI:
Energi använd per tidsenhet ÷ (Area × (1 + |medel inomhus − utomhustemp|))
Du anger de indata KPI:et behöver: energiserien (förbrukning), utomhus- temperaturserien, inomhustemperaturserien (medelvärde), och byggnadsarean. Connectorn returnerar KPI:et som en tidsserie du kan rita i ett diagram.
Detta är samma beräkning som översättaren analytics-building-energy-efficiency.
Använd Yggio.ChartEnergy för att beräkna KPI:et direkt i Power BI;
använd översättaren istället när du vill ha den beräknad inuti plattformen och
sparad på enheten (så att den är tillgänglig för larm, dashboards och andra verktyg).
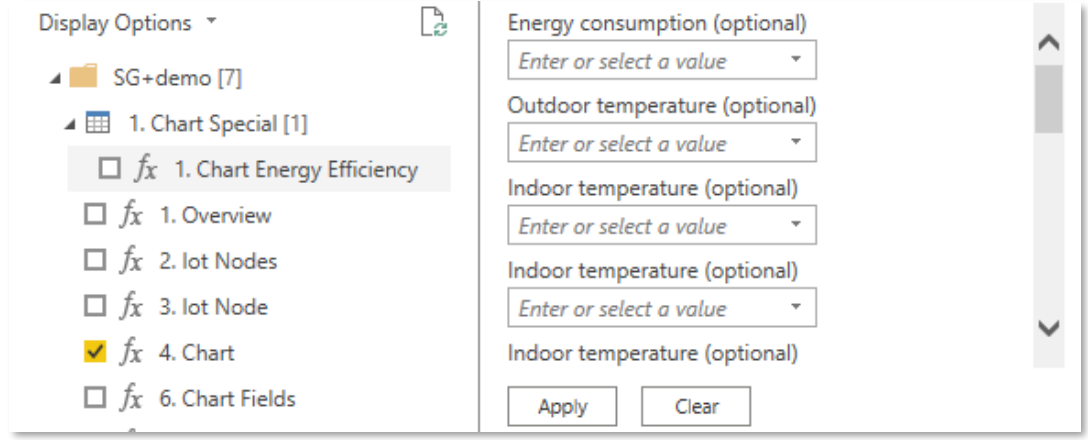
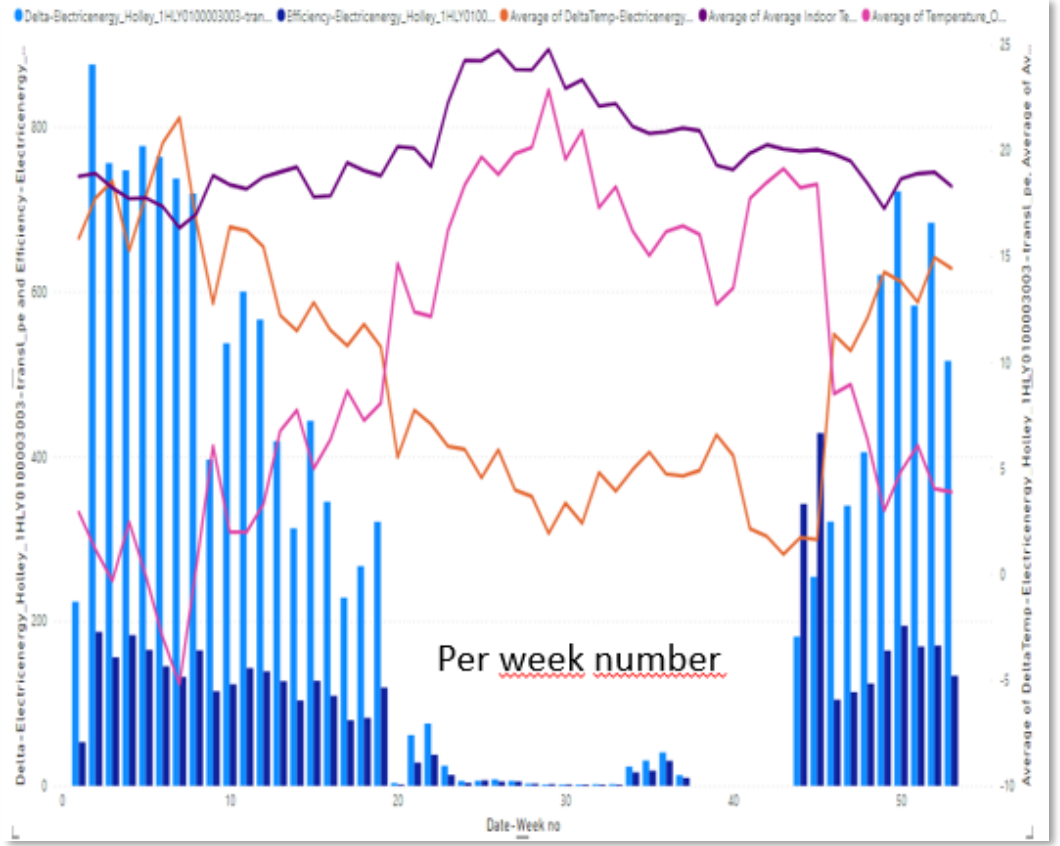
Om du förbättrar byggnaden (nya fönster, mer effektiv uppvärmning, etc.) bör energieffektivitets-KPI:ets staplar bli lägre.
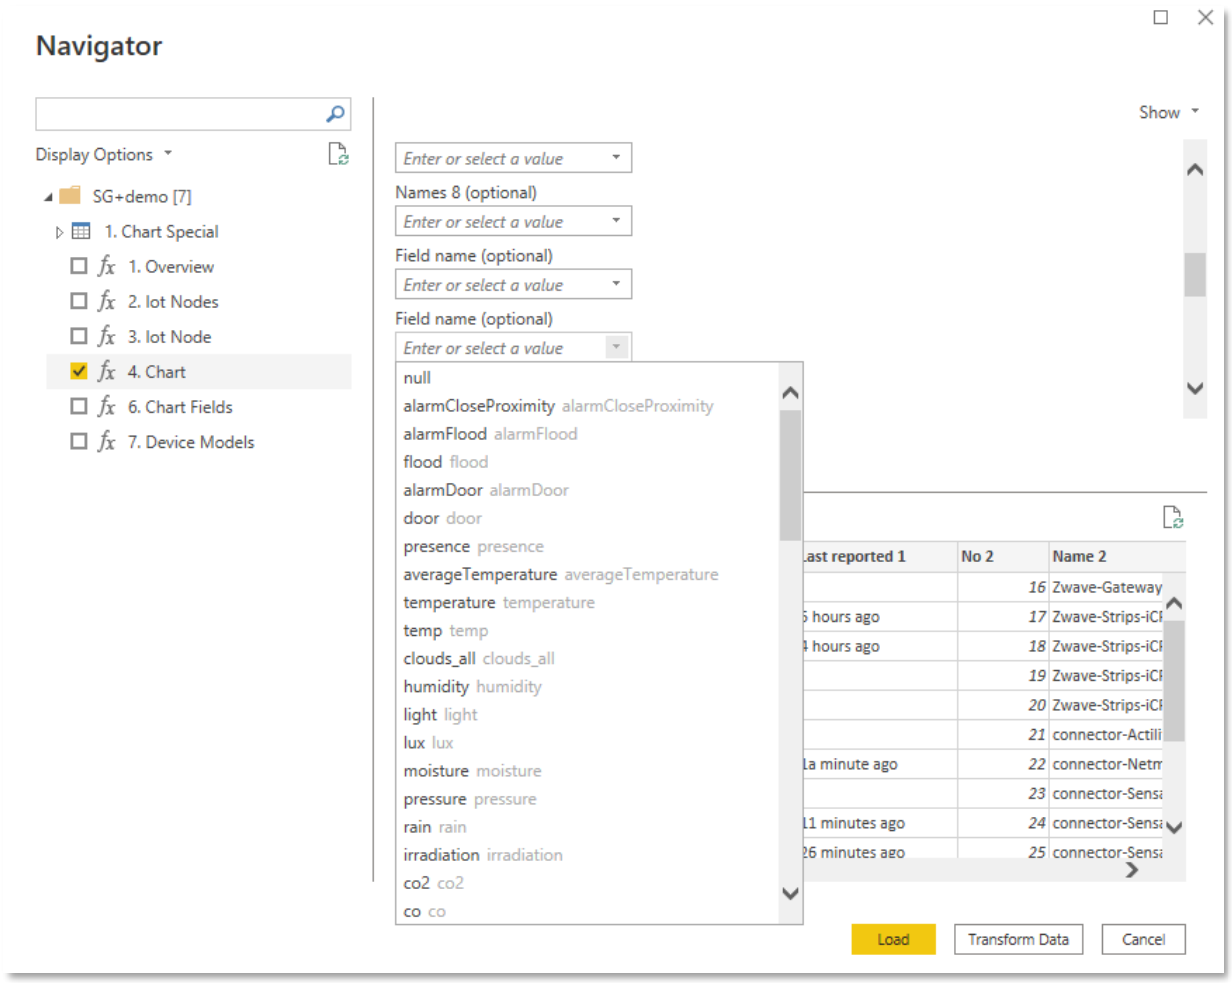
Markera kryssrutan bredvid en fråga och klicka på Load för att läsa in datan i Power BI för analys och rapportering.
3.2 Formula bar (formelfältet)
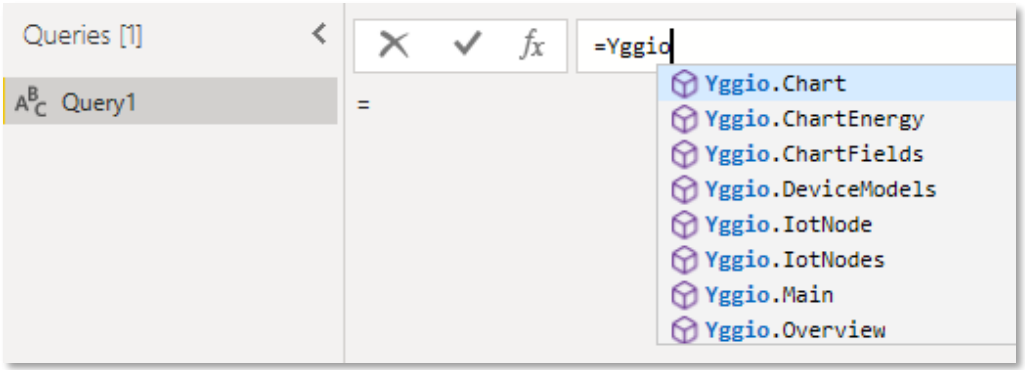
Öppna formula bar via den lilla nedåtpilen under Get Data → Blank query. En
Power Query-redigerare öppnas med markören i formula bar. Skriv =Yggio för att
se listan över frågor; välj en och tryck return för att visa dess gränssnitt,
dokumentation och fullständiga syntax. Frågorna skiljer sig i syntax och krävda
parametrar men delar samma stil, så de blir snabbt bekanta.
(Yggio.Main är Navigator-specifikationen - ingen funktion från formula bar.)
Den första parametern i varje fråga är IoT-plattformsservern; du kan ange fler parametrar i det första steget, men det är alltid okej att bara ange servern plus autentiseringstaggen och klicka på Invoke.
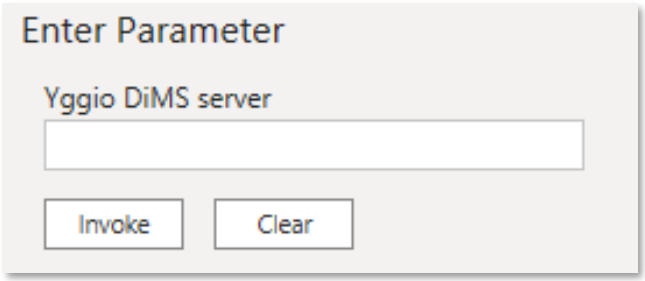
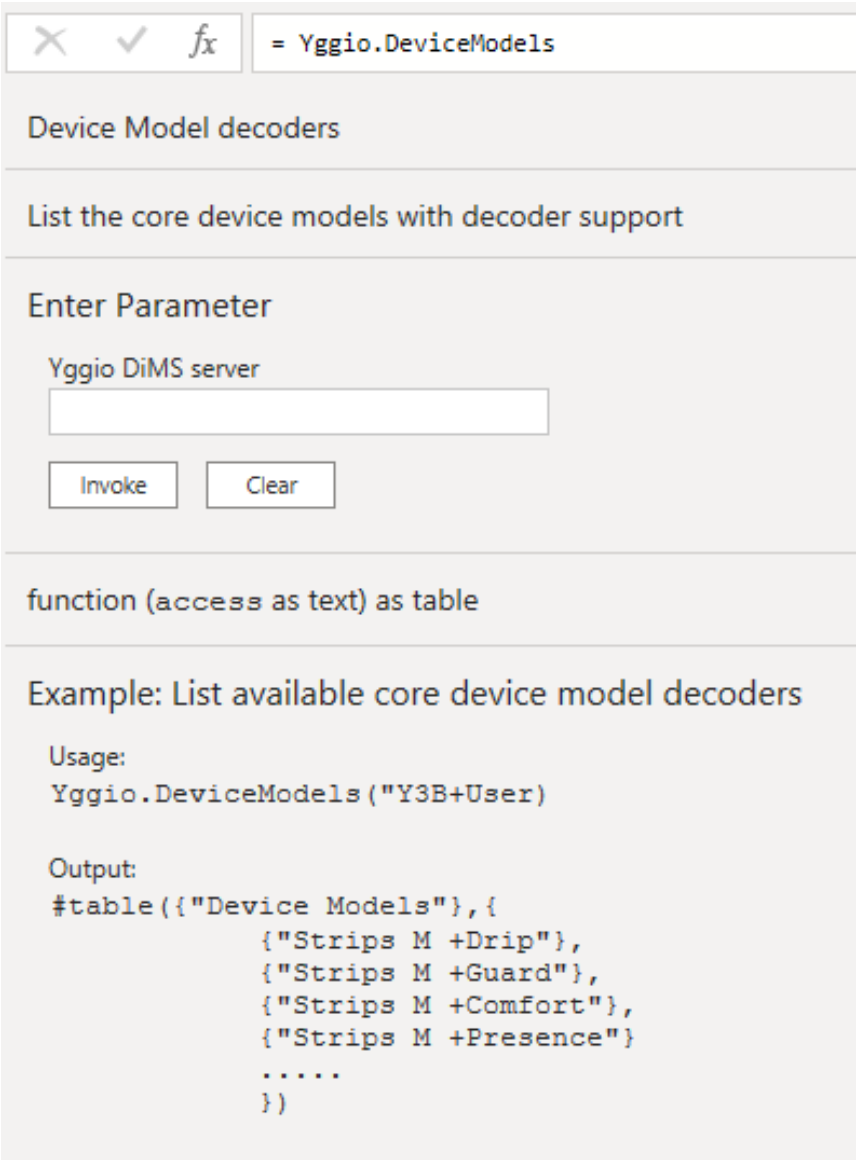
Efter Invoke och autentiseringsuppgifter loggar Power BI in och visar ett gränssnitt för att fylla i de återstående parametrarna, med alla tillgängliga noder förifyllda i listorna.
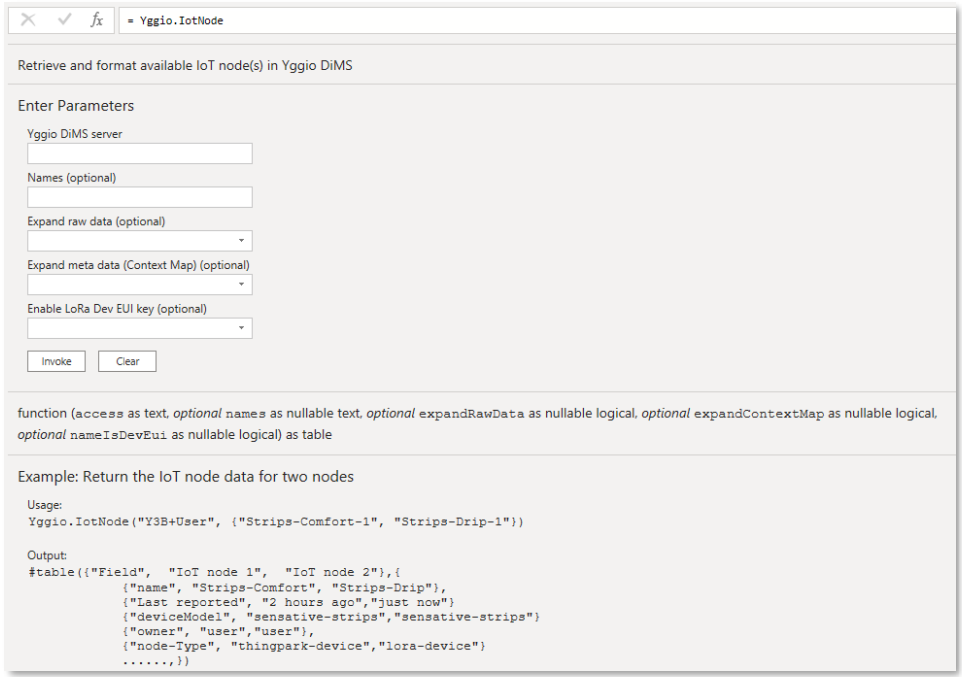
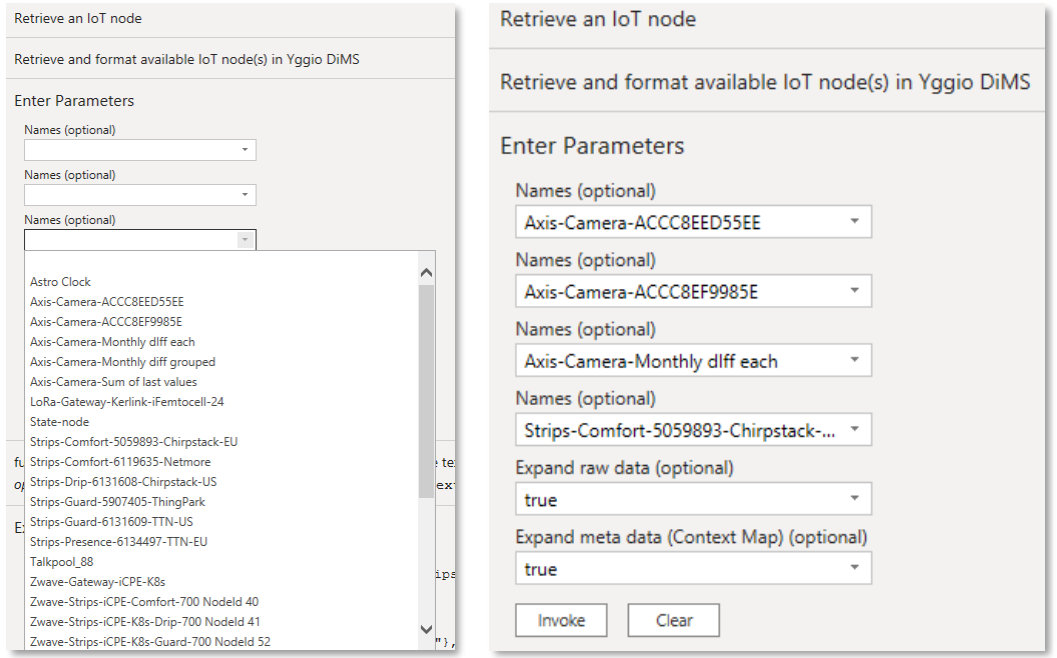
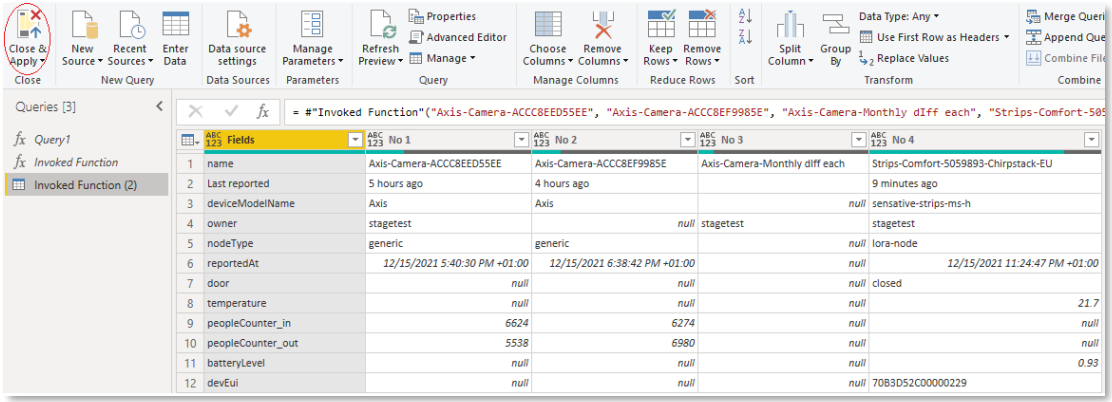
I steg 2 (beroende på frågan) kan du välja att expandera nästlade JSON- strukturer såsom rådatan och Context Map (metadata). Klicka på Invoke igen för att läsa in datan i Power Query-redigeraren, där du kan omvandla den innan Close & Apply.
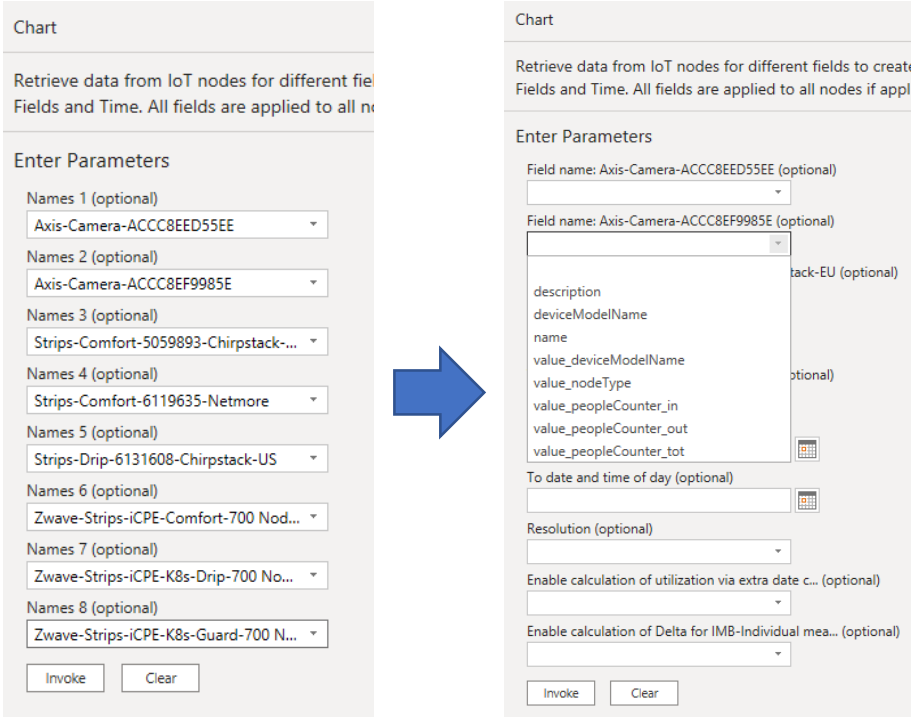
Fördelen med formula bar jämfört med Navigator är att för Yggio.Chart/
Yggio.ChartEnergy fylls de tillgängliga tidsseriefälten per nodnamn i
förväg för de första 3 av 8 noder (det 4:e fältet förblir den fördefinierade
listan för de sista 5 noderna).
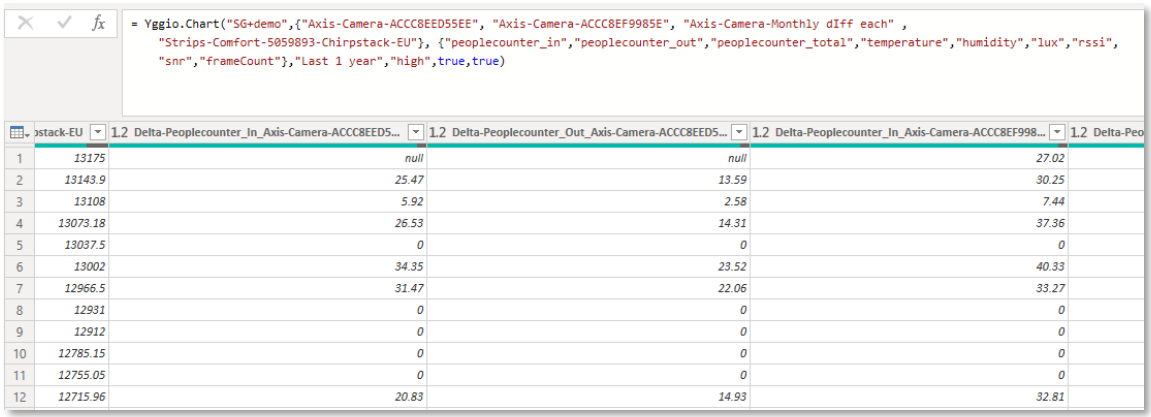
3.3 Ange hela frågan direkt i formula bar
Förutom automatisering från PowerQuery är den huvudsakliga anledningen att skriva hela frågan
direkt att undvika begränsningarna för antal noder/fält. Nodnamns- och fältnamns-
parametrarna accepterar listor - {"par1", "par2", "par3", ...} - vilket låter dig gå bortom
gränssnittets gränser. Power BI ger syntaxhjälp när du skriver parametrarna.

4. Power BI-tips och exempelrapporter
När en datamängd har hämtats, klicka på Close & Apply i Power Query-redigeraren för att läsa in den, byt sedan till rapportredigeraren (grafikonen längst upp till vänster).
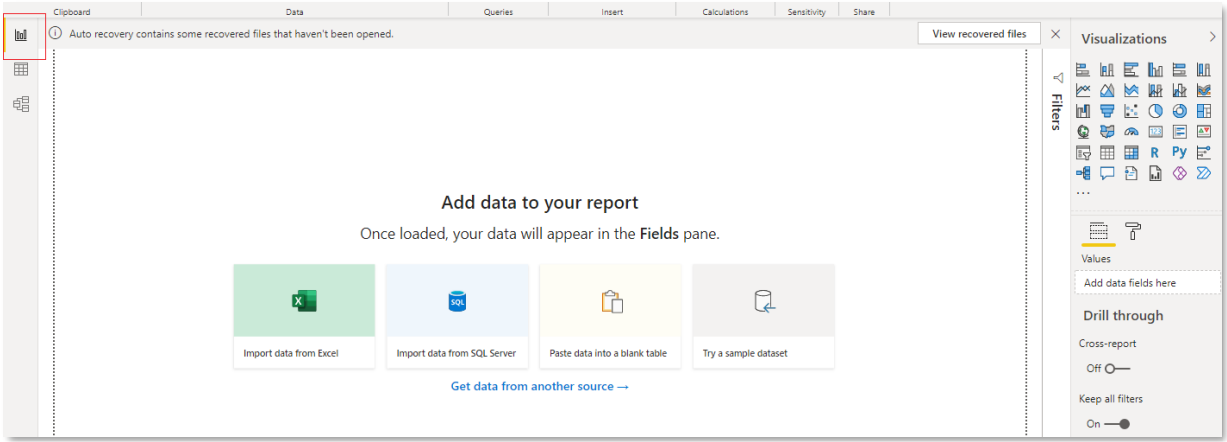
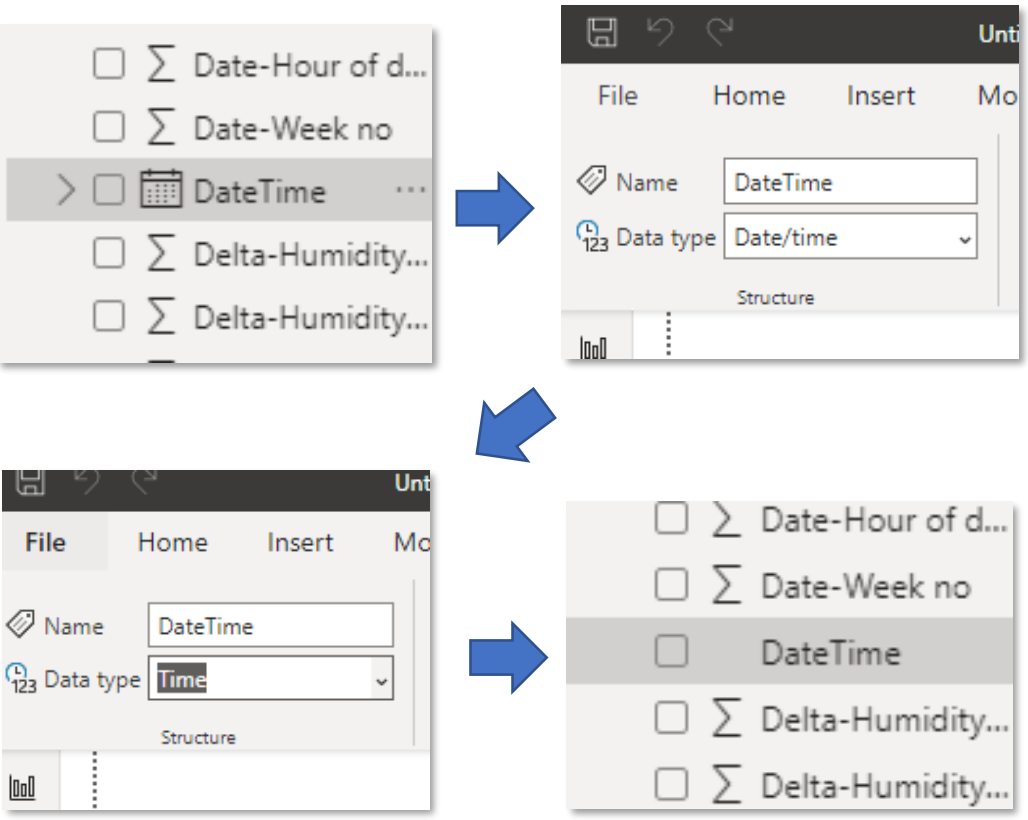
Det viktigaste första steget: ändra datetime-kolumnens typ från
datetime till time. Annars grupperar Power BI all data och de flesta diagram-
widgets fungerar inte som förväntat.
Tips - forma data innan inläsning. Välj Transform Data (istället för Load) för att öppna Power Query först, där du ställer in tidskolumnens typ, döper om fält och filtrerar rader, och sedan Close & Apply. Load bara läser in datan med connectorns standardinställningar - du kan fortfarande justera den efteråt.
Tips - gruppering över tid. För rapporter som grupperar efter timme/dag/vecka/ månad, aktivera Chart-frågans alternativ extra date columns (avsnitt 3.1); det lägger till färdiga grupperingskolumner, så du inte behöver bygga datumlogik i Power BI själv.
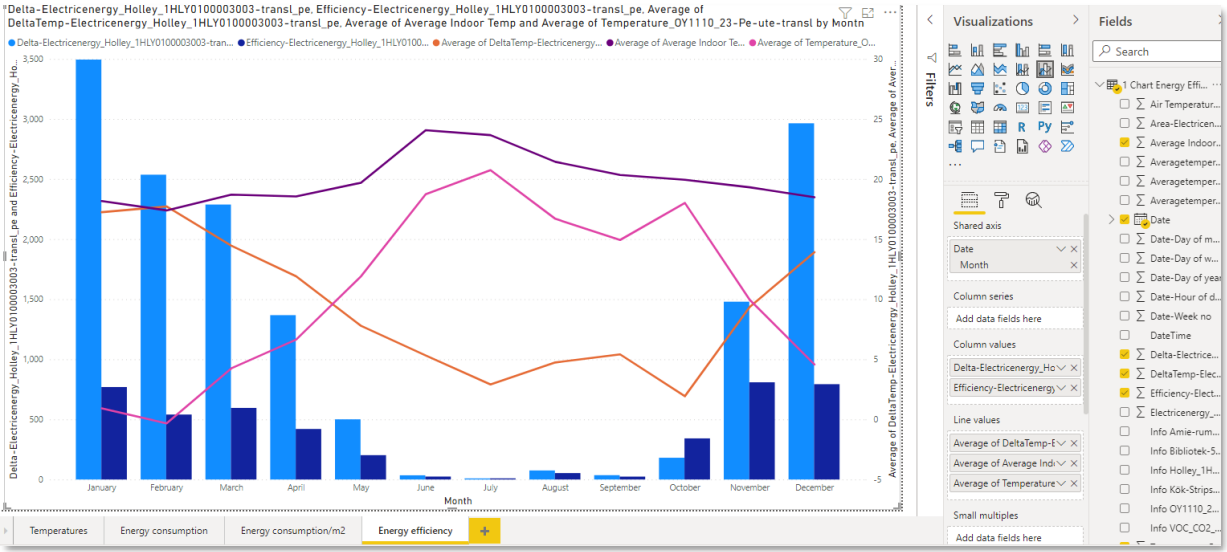
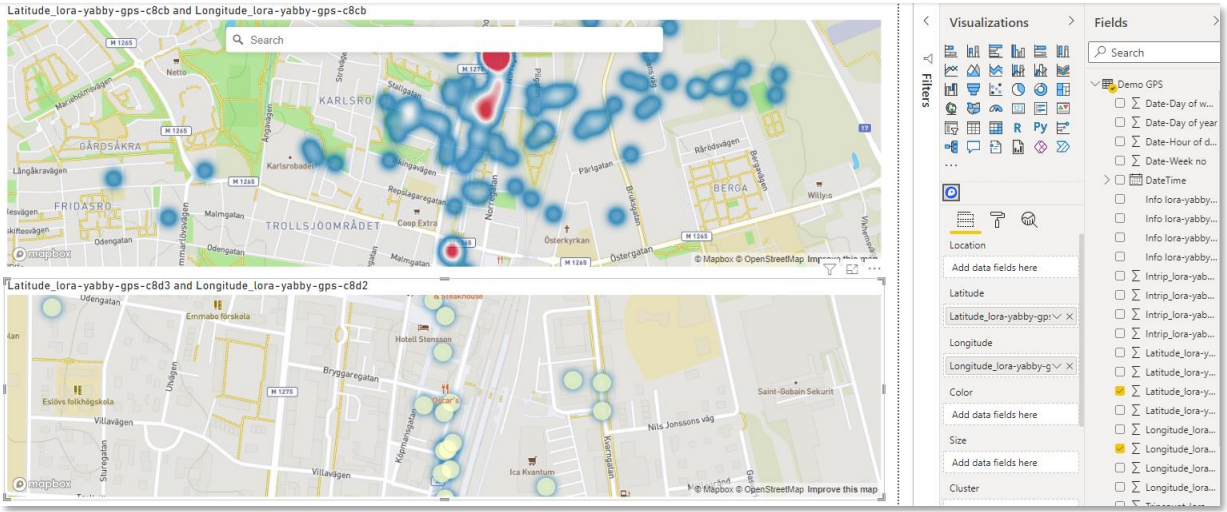
Börja därefter med grundläggande widgets - Line chart, Column chart, Pie chart - och experimentera genom att dra tids- och datafält till deras fält. Varje widget låter dig oftast välja hur värden kombineras inom samma grupp (sum, average, etc.), beroende på vad du vill visualisera.
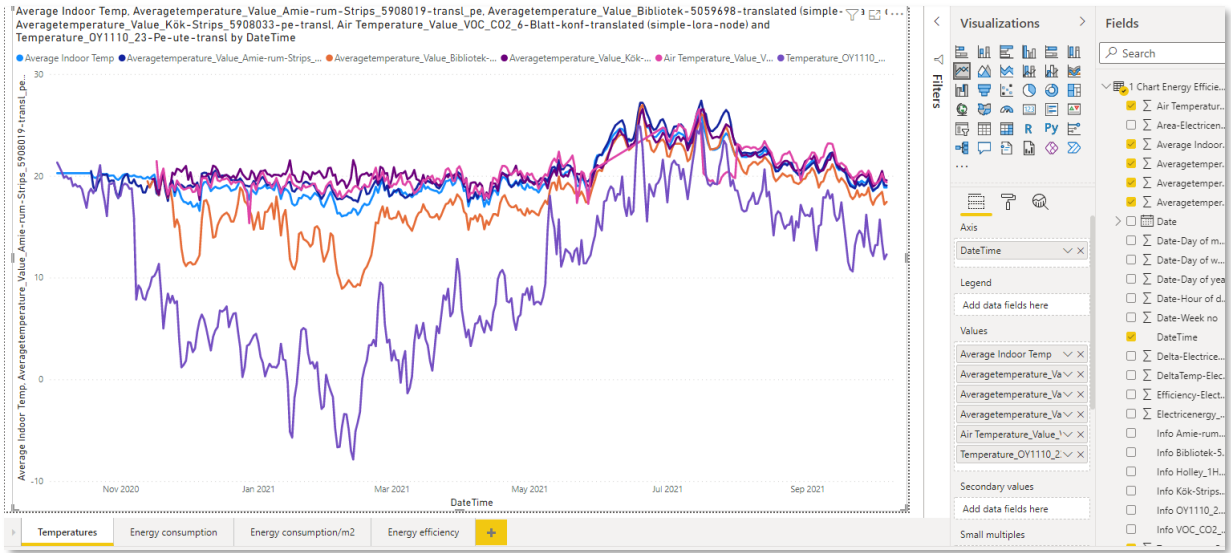
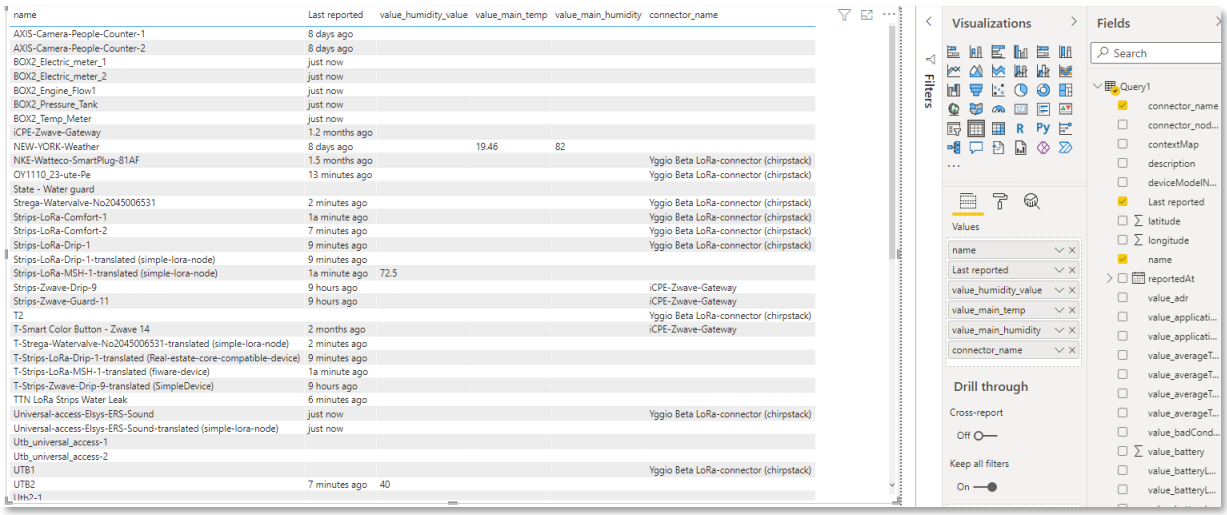
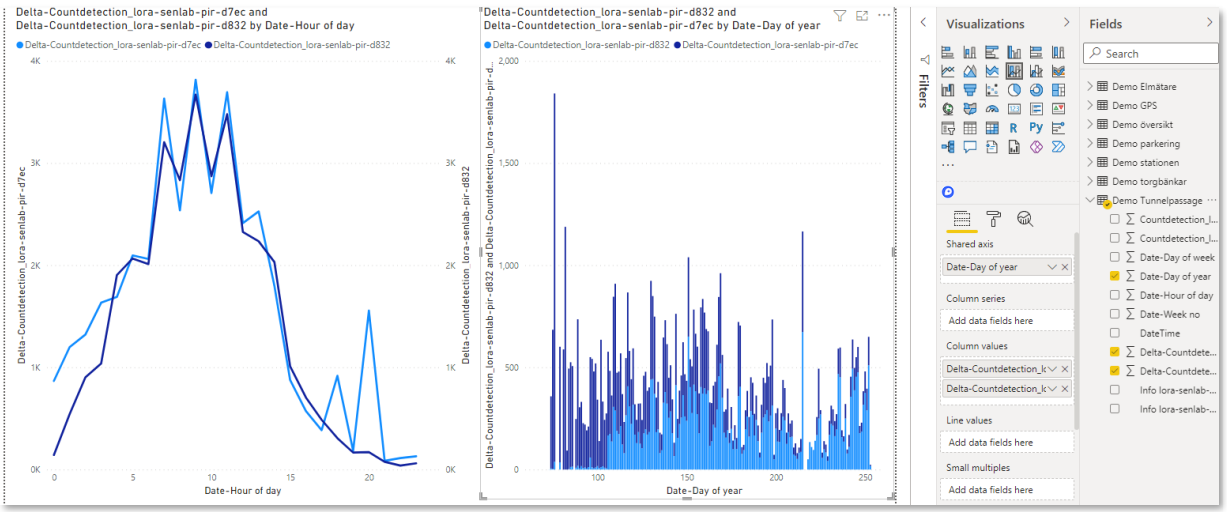
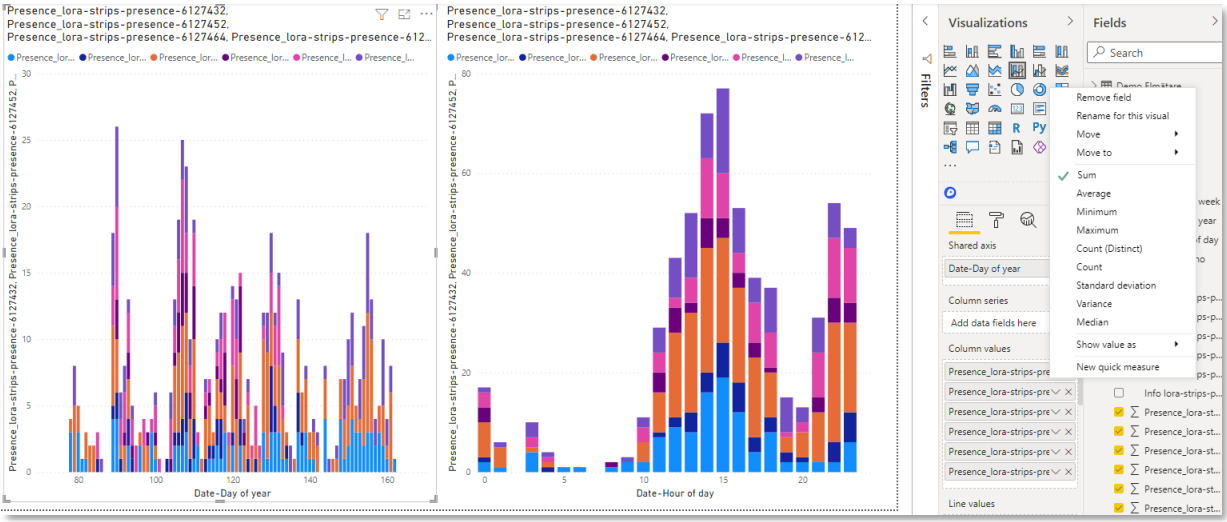
Uppdatering och delning
-
Power BI Desktop uppdateras på begäran - klicka på Refresh, eller kör frågan igen.
-
Schemalagd uppdatering och delning (att publicera till Power BI Service) kräver en lokal datagateway i standard(enterprise)-läge - den personliga gatewayen stödjer inte anpassade connectors. Sätt upp den en gång:
- På gateway-maskinen, installera connectorn på samma sätt som på
skrivbordet - lägg
YggioConnector.pqxi den maskinens mappCustom Connectorsoch köraYggio_regkey.reg. - I gateway-konfigurationen, tillåt anpassade dataconnectors.
- Spara IoT-plattformens autentiseringsuppgifter (användarnamn/lösenord eller API-nyckel) på gatewayens datakälla.
Att använda Power BI-molnet är valfritt - Power BI Desktop fungerar bra på egen hand.
- På gateway-maskinen, installera connectorn på samma sätt som på
skrivbordet - lägg
Nedladdningar
- Yggio Power BI Connector (zip, v1.1.1) - innehåller
YggioConnector.pqx+Yggio_regkey.reg.